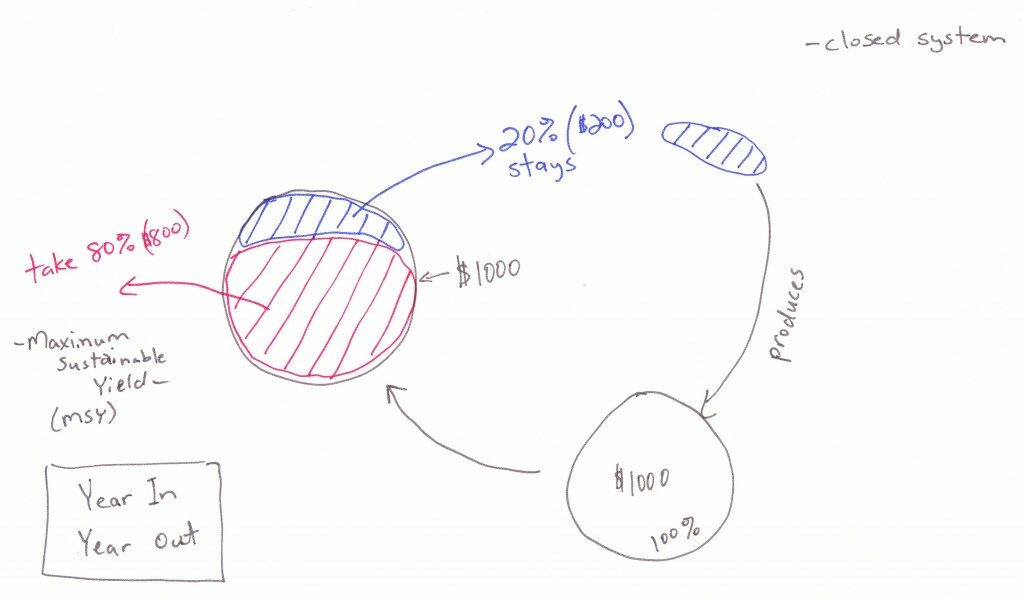
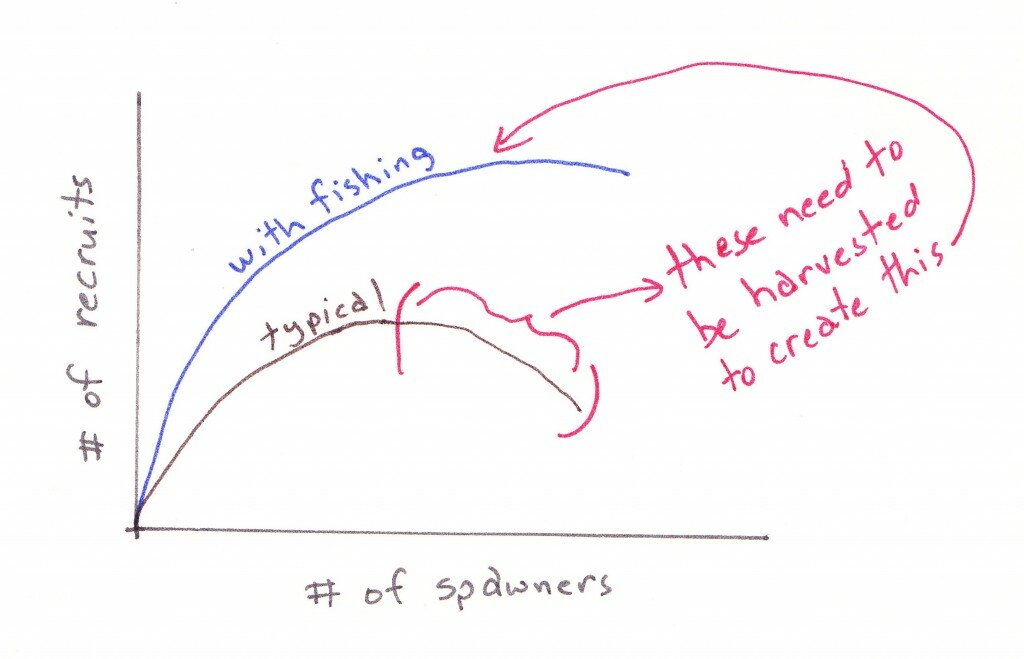
Yesterday was a on finding free money through my “FLIRT model” (Free Lunch/Investment Return Tool). (Note: I’ve resorted to pen and paper to start drawing some of this stuff out — computers often get kind of limiting in this sense…)
Today, I’d like to introduce my latest investment strategy model; it’s called Formulating Really Super Strategic Investments (FRSSI) – we’ll call it “frizzy”… to keep it fun. This frizzy model is so great. It takes information from a stock market — let’s call it the Fraser Market, for simplicity sake.

Approximately 200 separate stocks
In the Fraser Market are approximately 200 individual stocks. Some of these stocks are big; some of these stocks are medium size; some are small. However, all of these stock are individually unique; distinct; diverse.
Upon further analysis, and the introduction of some new legislation in 2005 — the Winking Stock Policy (WSP) determined that in actual fact, these 200 separate stocks are not entirely unique — there are some shared similarities and many of these stocks could be grouped together into common Conservation Units (CUs).
Some scientific analysis, several consultations, Peer Review (PR) and countless meetings later; it is determined that these 200 stocks can actually be grouped into a little over 40 separate CUs.
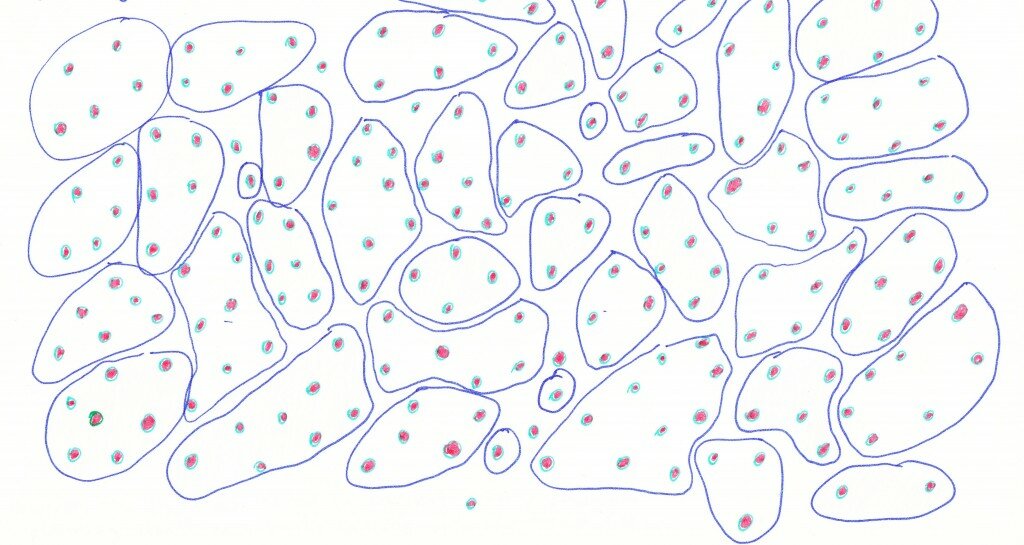
Approximately 40 CUs
Some of these CUs have five or six similar stocks; some only have one or two stocks; and some stocks were left out of the mix because they just didn’t fit the mold.
However, for our FRSSI simulation Free money forecasting tool, we actually decided not to use the 40+ CUs in the investment forecasting.
We recognize that there is some other planning and consultation going on in relation to the CUs, but we’ve actually come up with a better plan — we’re only going to use information from 19 stocks in our forecasting simulations. We’re only using the 19 stocks because these are the bigger stocks — the more productive stocks that are going to ensure our annual returns (and Free Money). By concentrating on these bigger stocks we won’t waste our time on those smaller stocks that bring fewer returns — the bigger stocks are much better at guaranteeing we can harvest some of our returns every year.
We don’t have good information on the other 20 or more CUs and other 180 individual stocks — those are small stocks so we don’t worry about them in our simulations. We focus on the nineteen big fellas…

By focusing on the nineteen big returning stocks and using information from the past, we can actually extrapolate results and forecast for the entire 200 stocks anyways and thus the entire Fraser Market.
Now… to further simplify our FRSSI calculations we have further grouped our 19 stocks (some are also CUs) into four aggregates — or groups — for “management purposes”. Based on timing within the Fraser Market and when the market produces returns, we have named these four aggregates: Early Stuart, Early Summer, Summer, and Late Summer.
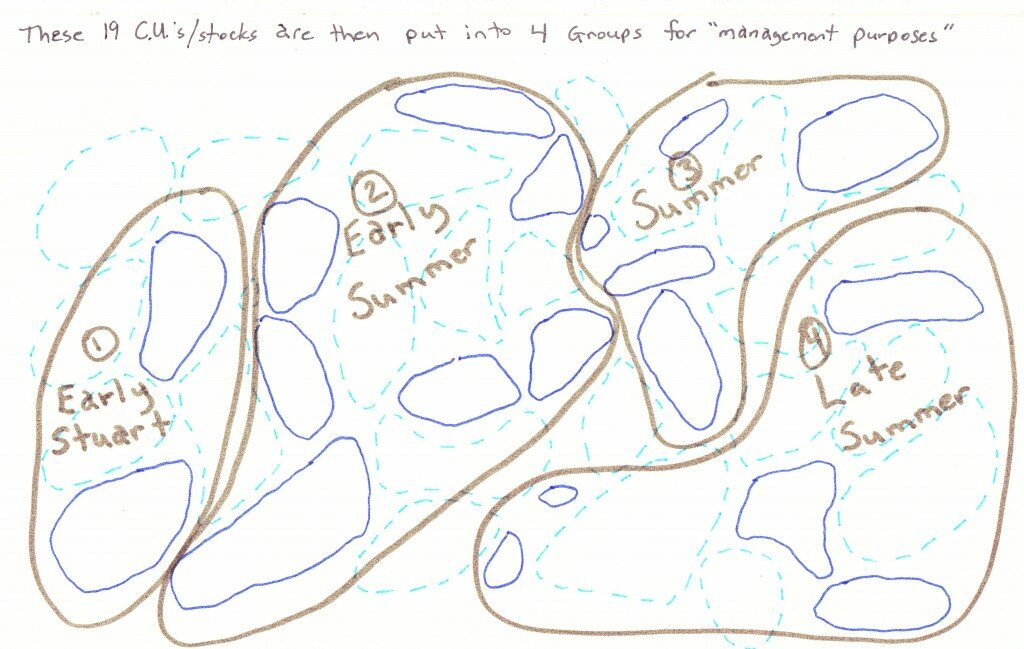
200+ stocks into 40+ CUs into 4 Aggregates
It’s an incredibly, forward-thinking, forecasting model for Free Money.
The computer model takes information from the past on these 19 of 200 stocks (~10%). These have then been broken down into four groups. This information then simulates returns for the future.
Based on the simulated returns for each of the 19 stocks, various options for how we want to harvest our returns are presented — these are based on forecasting out for the next 48 years and how that will impact our investments.
It’s truly remarkable. We have successfully designed a method for securing Free Money, when we only have patchy information on 19 of 200 stocks. We have then made four groups out of those 19 stocks; we then forecast your free money returns based on simulations that don’t even need to consider any outside influences.
It’s brilliant, simple, and….
………..
Screeeeech!! (sound of needle across record…)
Is this sounding a little ridiculous? It is.
However, this is how Fisheries and Oceans Canada has designed a computer simulation forecasting model for managing Fraser River sockeye. The acronym is FRSSI — frizzy — the Fraser River Sockeye Spawning Initiative.
This computer simulation program has been developed over the last eight years at a cost of countless million of dollars and staff time. FRSSI is supposed to be a “Pilot Study” within the Wild Salmon Policy; however it appears that it is becoming an official planning tool.
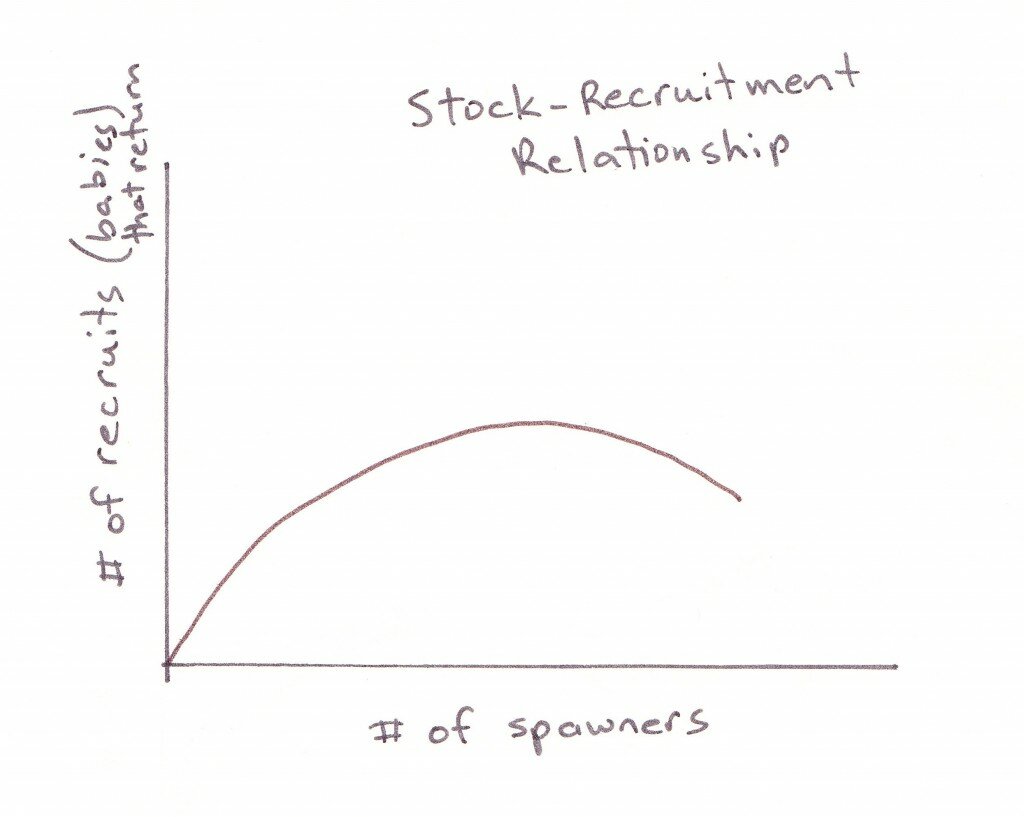
One of the fundamental principles of the computer simulation model is the theory of stock-recruitment analysis (see yesterday’s ). Stock-recruitment (S/R) analysis is built upon some fundamental assumptions. One being, that it only considers the relationship between number of spawners (stock) that reach spawning grounds and the number of returns four years later to the same spawning grounds (recruits).
It does not consider productivity of the freshwater environment, the ocean, predators, and so on, and so on.
Just “STOCK”……….. and……….”RECRUITS”.
A further problem, beyond it’s very narrow considerations, is that it takes over four years to get one data point to then put on a graph. For example, this many spawners (stock) this year….. four years later this many spawners (recruits) = one data point. Fisheries and Oceans has only really been keeping track of some stocks (generally the bigger returns) since 1948, or so. If it takes two separate years to get one data point to graph – this means in the last 60 years of collecting information, we only have 30 data points to graph.
Is this enough points on a graph to determine trends?
Let’s add another serious hiccup into this strategy…
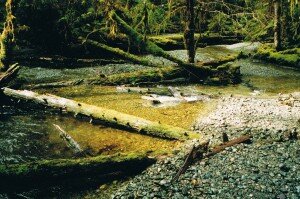
Counting fish is hard stuff. Sockeye swim in schools, they swim deep in a river, shallow, middle, side and so on. They also spawn in rivers where it can be tough to see anything in the water (every visited the Chilcotin River in the Interior — it runs glacial blue-green with huge loads of silt).
Thus, various methods have been devised to count fish. On smaller runs, it’s often simple visual counts. Sometimes this is done on foot, sometimes this is done from a helicopter, sometimes its done by counting carcasses on gravel bars. On larger runs, there’s sonar counts, DIDSON, catch-per-unit of effort in test fisheries, and mark-recapture methods.
Numerous studies have been done to test the accuracy of all these methods. Visual methods generally estimate salmon runs too small. Mark-recapture — utilized to count bigger runs — often over-estimate salmon run sizes. Bottom line is that getting an accurate count on the size of a spawning run (i.e. the number of returns) is a highly variable exercise — nothing more than guesstimates.
Thus, our stock-recruit graphs, with limited data, can have margins of error anywhere between 1% to say 80%. Fisheries scientists are then using this wide margin of error data, with limited data points, to put on a graph and then determine “trends”.
Worse yet — FRSSI is built upon the assumption of the (yesterday’s post) on stock-recruit graphs. For example, the Chilko (tributary to Chilcotin River in BC Interior) run shows a classic dome-shaped relationship in the number of recruits per spawner from four years previous. So does the Quesnel River run that migrates into Quesnel Lake.
from DFO "Fraser Sockeye Escapment Strategy 2010"
This dome-shaped relationship suggests that the number of recruits produced by each spawner declines as spawner abundance increases. The theory is too many eggs and too many baby salmon reduces productivity. Thus to ensure maximum productivity in the ecosystem, humans have to harvest a bunch of salmon.
However, the Early Stuart sockeye run in the Fraser does not have this “dome-shaped relationship” in its stock-recruit graphs. That graph almost displays the complete opposite — an increase in “recruits” with an increase in spawners.
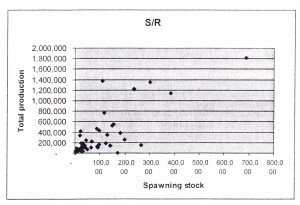
Early Stuart sockeye S/R plot
A colleague of mine the other day used the term “voodoo science”.
This computer simulation model for forecasting Fraser River sockeye returns is little more than voodoo science.
It is based upon data that are best-guesses (i.e. spawner counts and recruits). It only uses data from 19 sockeye stocks out of over 200. Then determines fisheries catch-levels for the entire Fraser River based on four aggregates of the 19 stocks.
The information on the 19 stocks is patchy and inconsistent and only goes as far back as the late 1940s. Worse yet, the 19 stocks don’t fit within the actual Conservation Units (CUs) that DFO has determined as part of the Wild Salmon Policy. Some of the individual stocks comprising the 19 are actual CUs, but some of the others are just stocks within a CU. It’s a patchwork quilt.
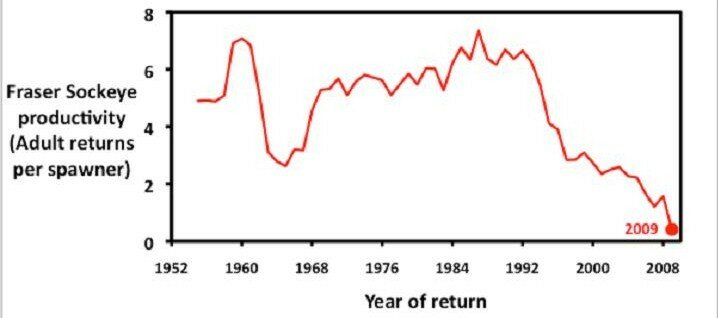
The forecasting model does not account for a train-wreck in productivity, climate change, high river temperatures, changing ocean conditions and so on.
If we wouldn’t trust an investment scheme designed this way (oh wait, we did, it’s called subprime mortgages and financial derivatives…) — then why should we “manage” an iconic species this way?
Yes, this is a somewhat simplified explanation of the tool — however, it does not take away from the fact that this forecasting model is built upon estimates; not exact science.
Would we construct a building this way, or a bridge? Would we sail along the west coast of Vancouver Island in a boat built upon simulated estimates? Would we put our kids on a plane built this way?
What if we took the money that was, and is continuing to be spent on this voodoo-science tool and put it into things we actually know we are having an impact on — like habitat damage, urban effluent issues at the mouth of the Fraser, water extraction from critical rivers, and so on?
What if we took the money that is being spent trying to “consult” on this tool that barely anybody understands — including a large portion of DFO staff, the Minister of Fisheries, and so on — and put it into community stewardship programs?
What if we took this colossal waste of money and put it into actually getting better counts of the number of spawners — rather than trying to simulate them in an office in Vancouver?
Aren’t we trying to get our kids off the Gameboys and computer simulation games and sending them outside to use their imagination and play in streams — why are we then wasting money, time and resources on designing computer simulation, voodoo-science tools to apparently do a better job of looking after wild salmon?
Instead of moving a mouse across a table, and our eyes across a computer screen, why not move our eyes across a stretch of river?
That’s exactly what I’m going to do right now…. off the computer and outside.





 Over 41 million Chinook fry released from major hatcheries. Almost 7.5 million from Community Development Projects and over 4 million from Public Involvement Programs.