I have a proposition for you. I have a fail-proof investment scheme that is guaranteed free money. And trust me… some folks suggest there is no such thing as a “free lunch”. Yet, I’ve got it right here.
It’s called my: Free Lunch/Investment Return Tool (FLIRT). Here’s the concept:
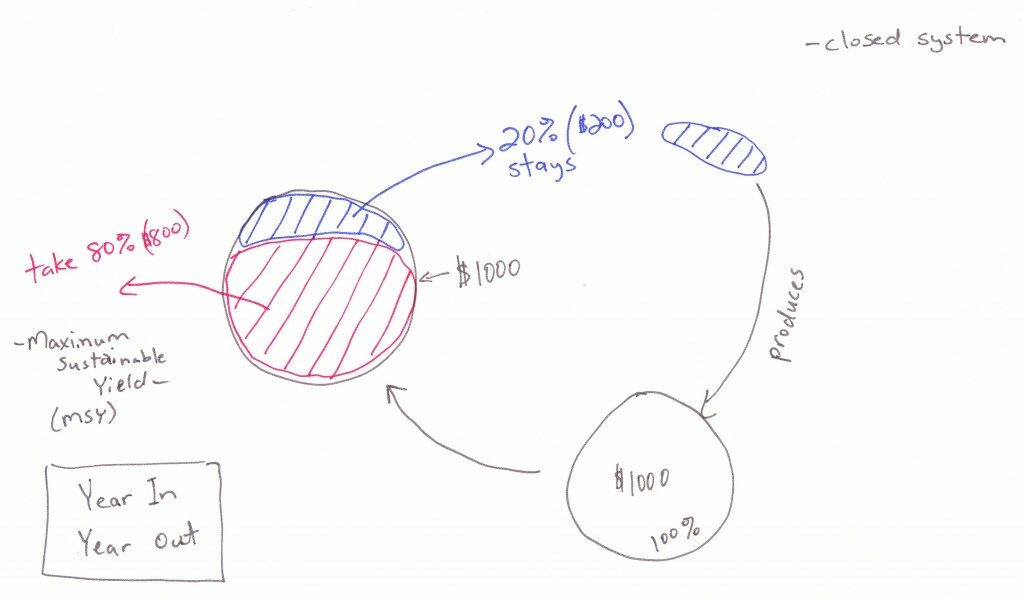
You have some money; principal, let’s call it… say $1000. This FLIRT is so good that I guarantee if you take 80% of your principal every year ($800), the 20% ($200) that’s left in the account will be sufficient to bring back $1000 the next year and thus financial returns large enough so that you can take 80% again the next year, and the next year, and the next year. Take 80%, and 100% of the original principal returns year after year.
This tool is so damn good — FLIRTing let’s call it — that we don’t even have to worry about all that other crap out there like: stock markets, surrounding business environment, or even what your neighbour is doing. It is so simple that we only have to ensure we grab that 80% surplus every year (this is the Free Lunch – FL). In fact, you actually have to take the 80% every year because if you take less than that — like say 60% — this will result in less return the next year. You must be vigilant in taking your 80% – and actually if you accidentally take 90% – FLIRT will still produce; maybe even better.
The reason we must be vigilant — i.e. take our free lunch: 80% return annually — is that if we let the remaining annual principal ($200) get any bigger, all that extra free lunch (i.e. returns) will just get stale, moldy, and impact our future returns (i.e. free lunches). We only have so much carrying capacity in our accounts — we don’t want to use that all up, overcrowd it, and so on. Say for example, we lose our FLIRTing vigilance and we only take 60% on an annual basis — leaving $400 every year in our account — the returns the next year just won’t be as robust. Too much free lunch is a bad thing and ensures we’ll get a worse lunch the next year, and so on.
FLIRTing ensures that every year we generate the “maximum sustainable yield”; year in and year out.
Yet, the reality is that taking 80% ever year is flirting with disaster, too many free lunches, and a downward spiral is underway for all involved.
Ok, so do you want to FLIRT? Sound ridiculous?
It is.
However, this is how salmon, and many other fisheries, have been managed for over 50 years. The concept of “maximum sustainable yield” came out of some hallowed educational institutions in the 1930s. It took over salmon management in the late 1940s and 50s and is still part of the current Wild Salmon Policy adopted in 2005.
The assumption is based on an old fisheries concept called stock recruitment. (Remember that military analogy from the other day?). Now I mean no disrespect to the individuals that created these concepts, they were cutting edge in their time — but so were PCBS, and asbestos, and atomic bombs. Just because they were cutting edge at one time does not mean blades remain razor sharp, or, even rust-free for that matter.
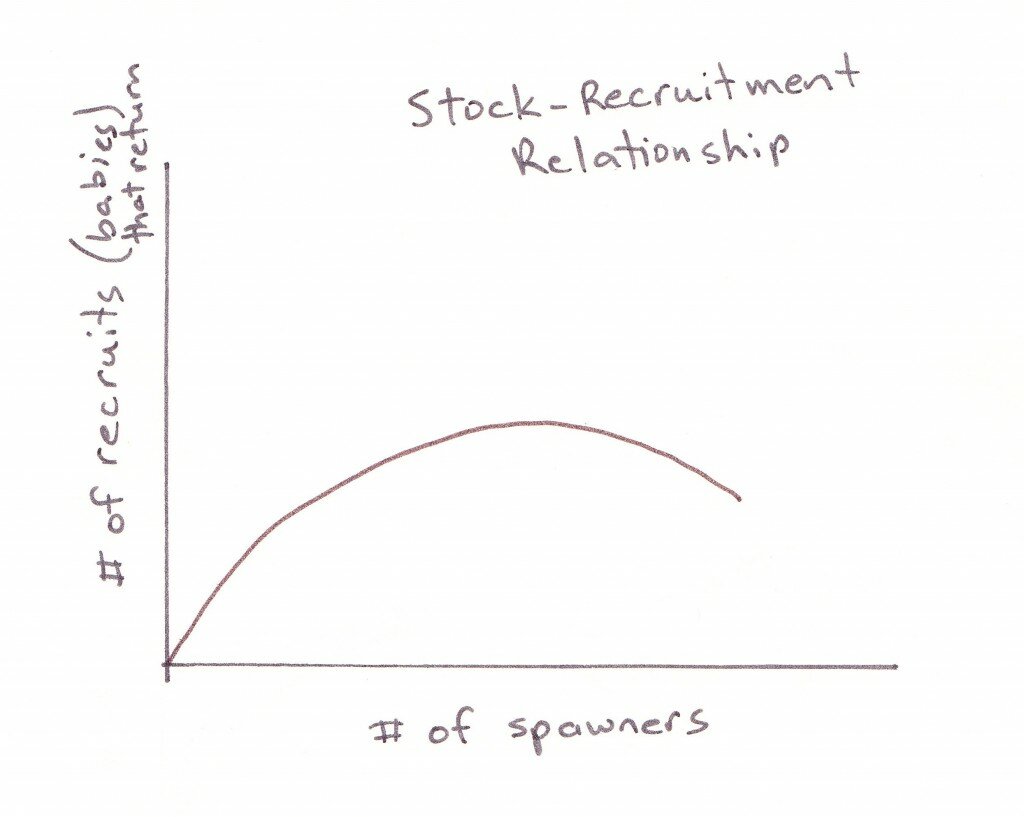
 The stock/recruitment (S/R) relationship theory suggests a certain amount of spawning fish (stock) reproduce a certain amount of baby fish that return as adults at the end of the life cycle (recruits). The theory suggests that in a natural state, the number of babies (and eventual recruits) produced by a salmon run begins to level off and even drop as the number of spawners increase — otherwise growth would continue indefinitely.
The graph is assumed to demonstrate a “dome-like” relationship, as shown in the sketch graph above.
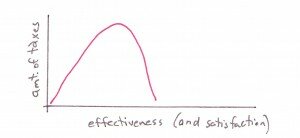
 There are comparisons with the classic salt curve or taxes curve. A little is good and effective up to a point, once the tipping point is reached though; too much quickly becomes very bad — for our health, for society, for everyone.
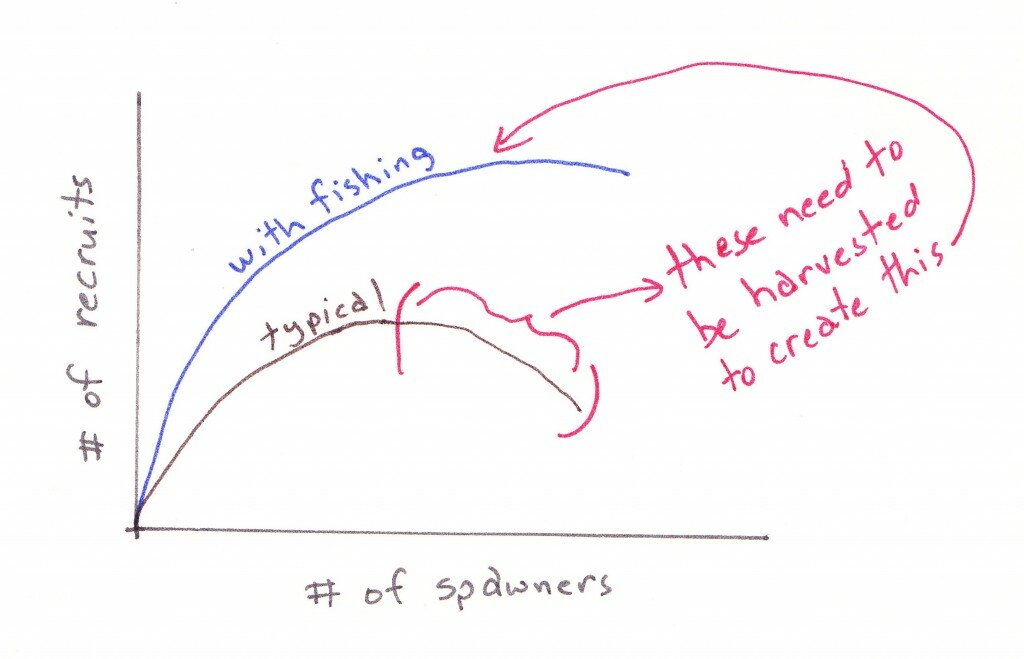
Fisheries science suggests that too many spawners is actually bad — overcrowding, disease sets in, spawners dig up each others’ eggs, and so on. Thus, the theory holds that a certain amount of spawners may be harvested without necessarily having a detrimental impact on the overall population. And in fact, in most cases harvesting fish may actually make the reproduction of babies ( and eventual recruits) more productive. More recruits means a higher harvestable surplus when spawners return. The theory being that if we find that magical point on the upswing of the “dome”, we can actually make spawning that much more effective (i.e. free lunch).
The theory suggests further… we need to determine the sweet spot where free lunches grow on trees; the sweet spot at which a certain amount of spawners produces the optimal amount of recruits. Once we know that sweet-spot number of spawners (optimal escapement or benchmark) required to produce the optimal number of recruits that can be harvested and theoretically reproduce the same size run four years down the road (i.e. typical salmon life cycle) — we have then apparently determined the Maximum Sustainable Yield.
When it comes to Fraser River sockeye, for close to 50 years the Maximum Sustainable Yield has apparently been 80% of the run. Fisheries science, and the institutions that “manage” salmon, figured that catching 80% of the Fraser sockeye population and expecting 20% of the run to reproduce the same size run four years down the road was a good idea, was sustainable, and was optimal for the health of the salmon.
Here’s the graph showing harvest levels on Fraser River sockeye over the last 50 years.
Statement from Think Tank of Scientists 2009
Remember that mention of the invention of bombs… MSY has turned out to be a bomb for salmon populations — especially Fraser River sockeye.
Of course, this is my humble, un-Dr’ed. opinion.
I’ll also add that many individuals much smarter than I, look at this blue line graph and the red line graph below demonstrating levels of Fraser sockeye productivity — and suggest there isn’t really a relationship. That we need more research, we need a “smoking gun”, we need conclusive evidence, it must be out there in the ocean…
Statement from Think Tank of Scientists 2009
I guess maybe I subscribe more to the less rigorous approach of a “balance of probabilities” as opposed to “beyond a reasonable doubt” when we start considering evidence.
One of the relationships between these two graphs appears to be the sad failure of stock-recruitment analysis in considering productivity of an ecosystem. Stock-recruitment accounts for nothing more than one relationship — the relationship between recruits and spawners.
The S/R model assumes a static ecosystem. This many spawners, results in this many babies, which results in this many ‘recruits’ — end of story. Yet, the red line graph shows a disturbing trend in Fraser salmon productivity. A ‘train wreck’. As other individuals suggest, the slowest train wreck you’ll ever see… but a train wreck nonetheless.
S/R analysis has no way of recognizing train wrecks in productivity. It only looks at two things: spawners and recruits a few years later…
Still want to FLIRT for free-money?


