Monthly Archives: September 2010

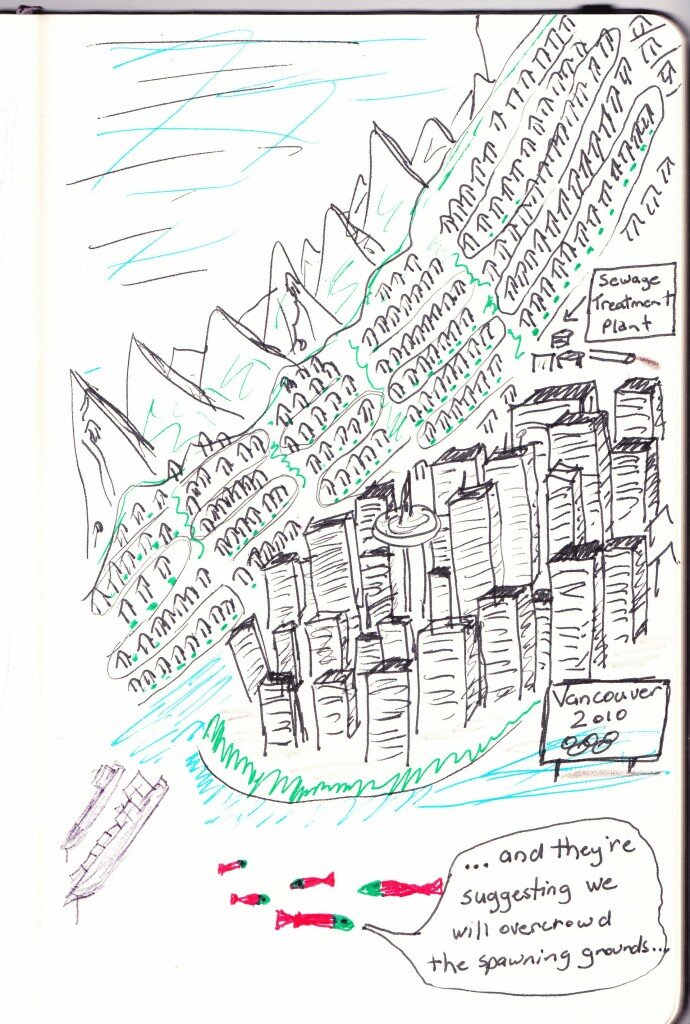
Vancouver Sun: “Tsunami of spawning sockeye floods into Adams River”

Great to hear:

Larry Pynn from the Sun writes:

So many sockeye are expected to arrive that the Adams River cannot accommodate them all, resulting in salmon seeking out other streams in the Shuswap region such as Scotch Creek, which has already had bumper returns this year.

Jeremy Heighton, the federal fisheries department’s representative for the Salute to the Sockeye Festival, running through Oct. 24, said counting the sockeye is continuing, although anecdotally “we’re seeing more fish at this point in the run than in the past.”

Already the river is about 60-per-cent full of sockeye, which is one to one and a half weeks ahead of schedule.

Whether or not all the sockeye spawn successfully, the bodies of the dead spawned-out salmon and their eggs are a huge nutritional source, both immediately to a host of plants and animals, but also later to emerging fry.

“Too many fish is a subjective statement,” Heighton said. “This is a bonanza for the animals, for the ecosystem. It’s like filling your fridge with everything you could imagine and being able to go in there and gorge yourself. It’s an incredible opportunity.”

Bravo, Mr. Heighton from DFO… now, if only…

If only the rest of the Department of Fisheries and Oceans would adopt that attitude.

Salmon as a bonanza for the animals and for the ecosystem…? you bet it is.

Yet…

SFU Salmon Think Tank - Dec. 2009

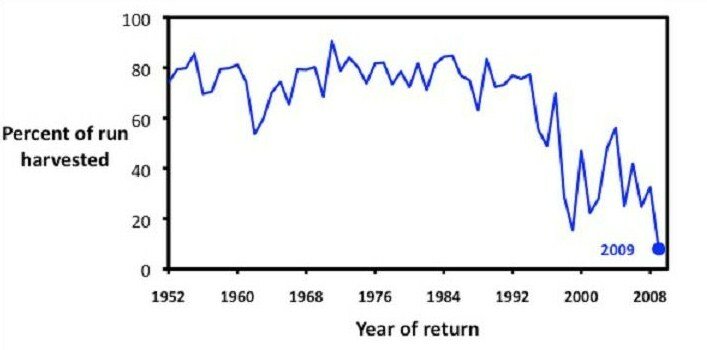
For over 40 years: DFO, fisheries scientists and fisheries advocates allowed – even made it policy, that about 80% of Fraser sockeye runs should be caught every year. Maximum Sustainable Yield? (for whom? — well…one critter in the ecosystem)

If it turns out this year that the catch is less than 50% of the total Fraser Run, and this is a bonanza… what does this mean the years between the 1950s and 90s were?

What is the opposite of bonanza?

Well for bears… probably “starvation”…

Salmon feed salmon?

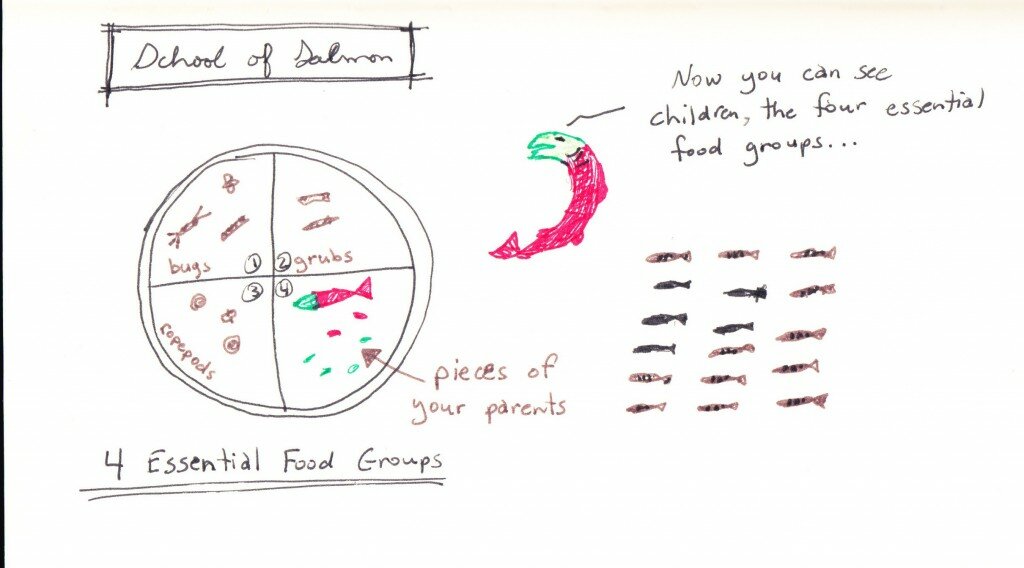
Four salmon food groups

Last Thursday I presented to the Cohen Commission through the public forums process.

One of the key points I tried to make was that salmon represent a huge energy source. It’s an energy source that involves salmon acting as huge sponges to absorb energy from the North Pacific — growing from smolts to adults as they circulate the currents of the ocean.

That energy returns in the form of adult salmon and is deposited deep into the interior of BC — and wherever else salmon migrate to.

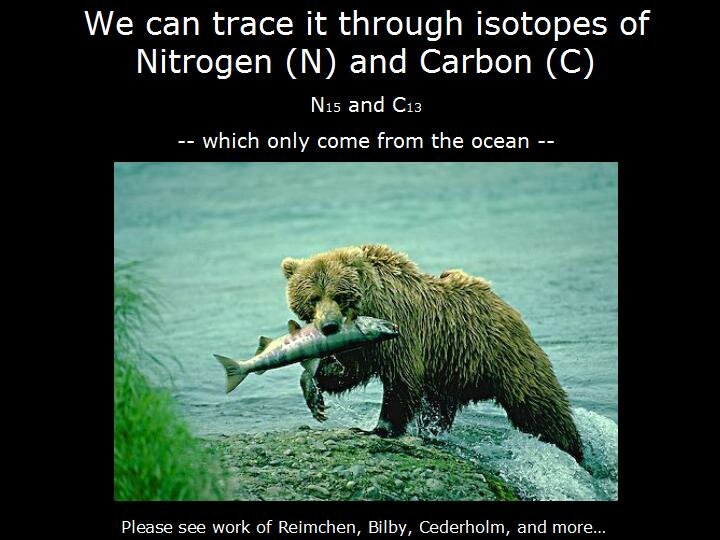
This energy can be tracked. There are certain isotopes of carbon (C) and nitrogen (N) that only come from marine/ocean sources: C13 and N15 . These isotopes are left behind all over the landscape as spawning adult salmon die, decompose and are eaten and then deposited through animal waste — and absorbed by plants.

You know the old saying when answering a questions in the affirmative: “does a bear shit in the woods?”

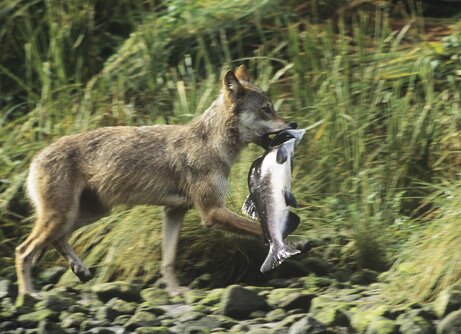
Well, yeah, it does… and if it’s been eating salmon that pile of poop has important nutrients in it for other critters.

Here’s a few of the slides:

In making reference to a few of the scientists that have been studying this; here’s a follow-up with some of the research that’s available readily online.

(Ben-David, et al. 1998)

Spawning Pacific salmon (Onchorhynchus) transport marine-derived nutrients into streams and rivers. Subsequently, these marine-derived nutrients are incorporated into freshwater and terrestrial food webs through decomposition and predation.

(Fujiwara and Highsmith, 1997)

In essence, this study found that decomposing adult salmon carcasses added nutrients to estuaries that increased production of very small critters which are a key food source for chum fry.

I think this might be referred to as the ‘cycle of life’…

The energy and nutrients transported from the ocean by salmon can be released into aquatic environments such as streams, lakes, and estuaries through carcass decay. If the imported material is sufficient to substantially increase primary or secondary productivity of the systems, anadromous behavior of Pacific salmon can be viewed as an adaptation to provide increased food sources for their offspring.

(Wipfli et al., 2003)

We tested the hypotheses that marine-derived resource subsidies (salmon carcasses) increase the growth rates of stream-resident salmonids in southeastern Alaska and that more carcasses translate into more growth […]

This study illustrates that marine nutrients and energy from salmon spawners increase growth rates of resident and anadromous salmonids in streams. This elevated growth should translate into increased survival and reproduction, ultimately elevating freshwater and marine salmon production.

Ecological relationships between salmon runs and aquatic community nutrition and productivity may be important considerations for salmon stock protection and restoration and for freshwater and marine ecosystem management.

(Michael jr, 1985)

This paper examines the relationship between the number and biomass of pink salmon spawning in Skagit River and the resulting return of adult coho salmon which were rearing as age-0 fish in the watershed at the time of spawning. From 1967 through 1985, during the odd-numbered years, there is a strong direct correlation between the biomass of pink salmon spawners… and recruit per spawner for coho salmon…

Traditional salmon management has concentrated on one species at a time. In order to take advantage of the enhancement benefit conferred by pink salmon spawners it will be necessary to examine interspecies impacts, reduced consumptive fisheries, changes in land use activities, and changes in stream flows from a much broader perspective than is presently employed.

_ _ _ _ _ _ _ _

And there are many more studies with similar messages.

Notice the date on many of these?

Several from the mid to late 1990s and into early 2000s.

Curiously, this was a similar time when Canada’s Wild Salmon Policy began it’s early incantations — 1999 or so. The Policy has lots of nice words about ecosystem-based management, conservation, and so on… however, next to nothing implemented on the ground.

This year, a brave decision was made in late Aug. to close commercial fisheries targeting the huge run of Fraser sockeye to protect weaker stocks (e.g. Interior coho and steelhead) that are often caught in the marine mixed-stock fisheries. This is a step in the right direction.

One must ask though… what about all the years of taking 80% of the sockeye runs, or other salmon runs? How much did that starve the ecosystem from that essential influx of nitrogen and carbon and energy?

Including the next generation of salmon…?

Gee, could there be a link with the across-the-board declines?

Could there be a link to the healthier returns this year, due to huge declines in salmon commercial fishing pressure over the last 6-8 years?

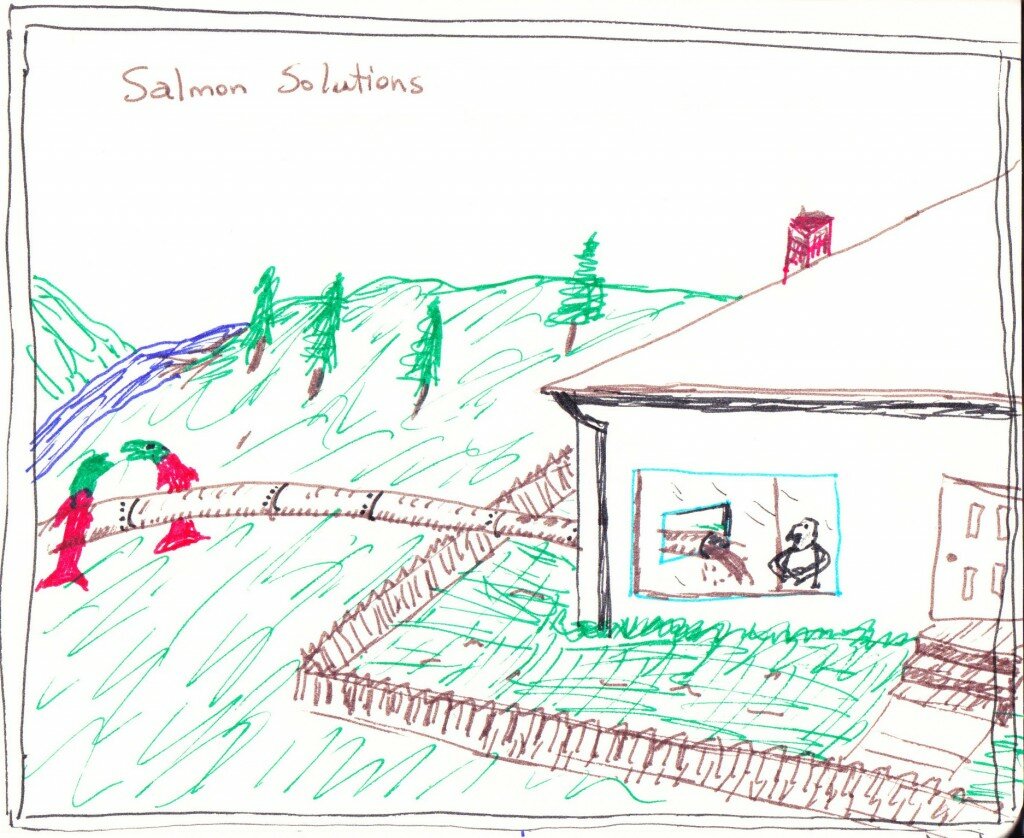
Salmon solution?

My Saturday morning relief from pondering the salmon sit-chee-ation:

inspired by Gary Larson

Pardon the pun, my seeking relief…

The other day as I prepared a presentation for the Cohen Commission,  I came across a report funded by the World Bank:

With an edge of cynicism, and trace of conspiracy theory… when I see reports funded by the World Bank looking at major river drainages… I start to think “dams”…

Apparenlty this “study” was part of the “Integrated River Basin Management and the Principle of Managing Water Resources at the Lowest Appropriate Level – When and Why Does It (Not) Work in Practice?

Scary little tidbit from the report, pg 48:

The largest input of wastewater occurs in the Fraser River Estuary, largely through effluents discharged from the Vancouver area wastewater treatment facilities. Together, three plants in the region release roughly 429,000 m3/day. A wide variety of industrial discharges, including metal fabricating plants, sawmills, pulp and paper mills, chemical plants and other activities release a range of contaminants in relatively low-volume discharges to the Fraser River. Other more poorly characterized effluents are those released through the 20 combined sewer overflows (McGreer and Belzer 1999), which transmit an estimated volume of 6,270,000 m3/yr to the North Arm and main stem of the Fraser (FREMP 1996).

Over 6 million cubic metres — in 1996 numbers!

One cubic metre of water is 1000 litres — Thus, over 6 million cubic metres is 6 billion litres (if my math is correct).

A typical toilet flush is about 5-7 litres. That’s a flush for at least every person on earth… in one year… in 1996… entering the mouth of the Fraser and Salish Sea.

What do you think it is now, 15 years later?

Might this explain why a longtime fisherman like Terry Slack didn’t see any of the great multitude of 30 million+ salmon in the Fraser North Arm this year (if I heard correctly, Terry?).

(Somebody better phone Houston and tell them we have a problem… or maybe just “text” or Twitter them)

_ _ _ _ _

But don’t worry I think I’ve solved the great salmon mystery:

Solving salmon mysteries

_ _ _ _ _ _ _ _ _ _ _ _ _ _ _ _ _ _ _ _ _ _ _

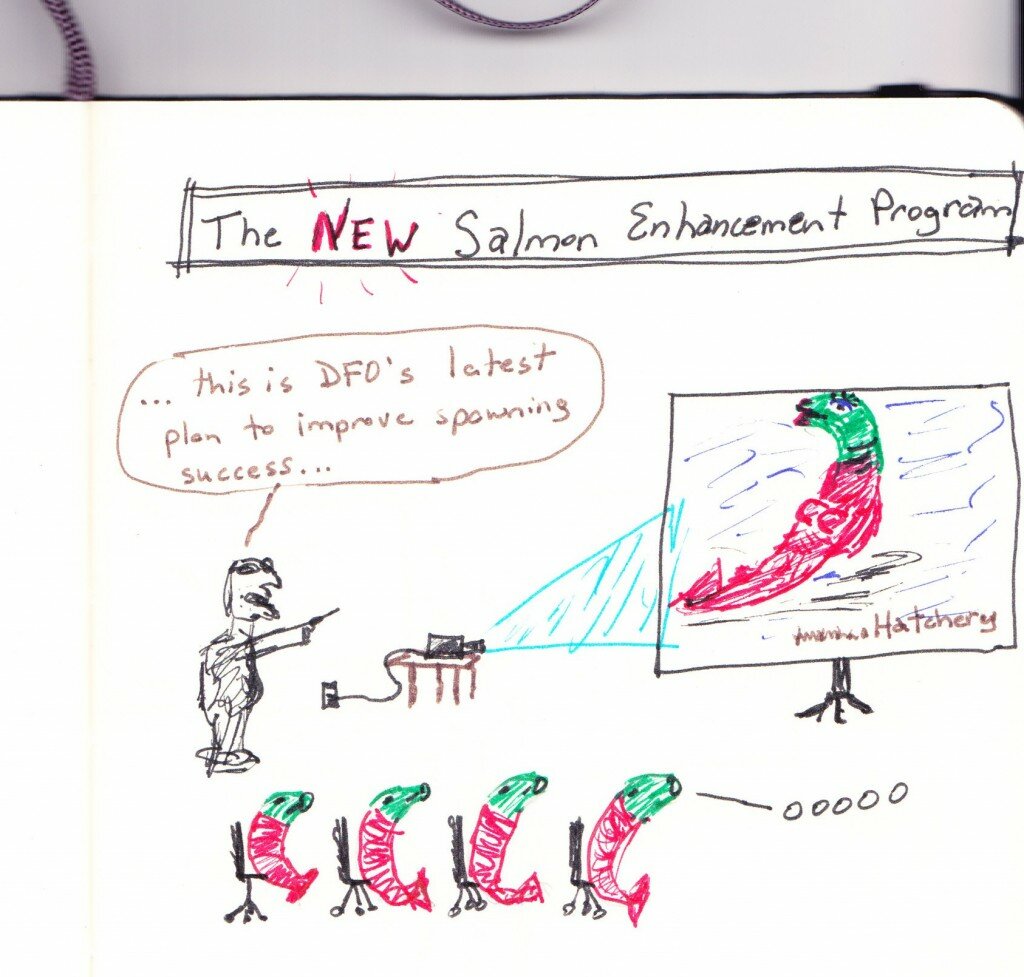
I’ve also heard about the development of a NEW Salmon Enhancement Program — the current one in B.C. pumps out over 650,000,000 salmon fry of various species out into the North Pacific to compete against the other 4.4 billion pumped out from around the North Pacific rim. All at great cost — financial, and to genetic viability of current wild stocks.

Salmon Enhancement Program?

_ _ _ _ _ _ _ _ _ _ _ _ _ _ _ _ _ _ _ _ _ _ _

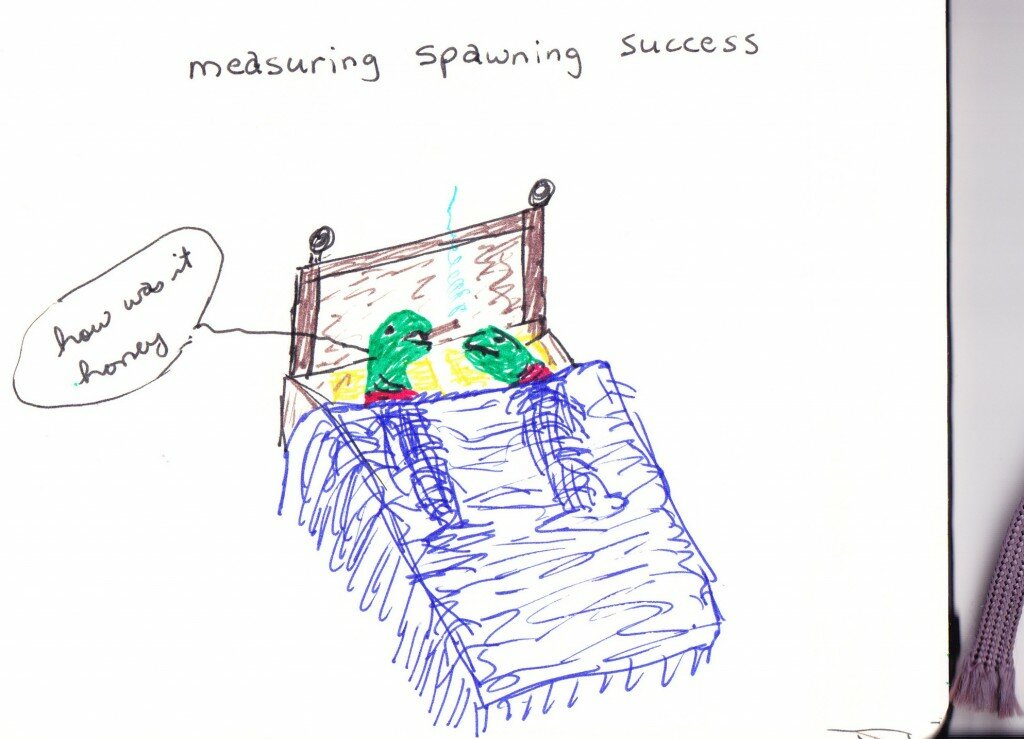
There’s also a new study being recommended to the Cohen Commission — Study #13 — “Measuring Sockeye Spawning Success”:

Sockeye Spawning Bed?

commending the Commission

Last night the Cohen Commission (Commission of inquiry into the decline of Sockeye Salmon in the Fraser River) made its debut in Prince George to hear submissions from the public.

I must commend the Commission on how they conducted business. I was impressed from the moment I arrived at the Cranbrook South room at the Ramada Hotel. I was warmly greeted at the door by Commission staff, given clear instructions on how to pass along my P.Point presentation to other staff, and simply treated with warmth and respect through the process.

No stern looks about arriving at 6:35 for a 6:30 start, no look over the top of the glasses for not sending my presentation earlier (which wouldn’t have been possible as I had just finished putting the presentation together 20 minutes earlier), and — most impressively — the set up of the room.

I have far too many experiences of government hearings (BC Aquaculture review, Priddle Panel of a decade ago on B.C. Offshore oil & gas activities, Kemess North mine expansion Environmental Review, recent Enbridge Northern Gateway National Energy Board hearings, and so on, and so on) — whereby the great “listeners” (Panel members, MLAs, etc) sit at their head table at the front of the room facing the audience and presenters sit at a table, backs to the audience and other presenters.

It’s an absolutely ridiculous, foreign, and disrespectful way of carrying out important business.

Last night, the Cohen Commission had the room set up in a circle, presenters facing the audience and standing beside Justice Cohen’s table. There was even the option to speak from the centre of the circle with a wireless microphone.

A welcome was given by a member of the Lheidli T’enneh First Nation — appropriate for the setting and the topic.

Presenters were asked to try and keep within the 10-minute limit — however, there was no oppressive overbearing presence if one went over the limit. Respect was shown for a small ceremony during presentations. And a gift was given at the end of the night for the Lheidli member who opened the evening.

It was a really nice change from what seems to be standard protocol for these types of processes — and for that I commend the Commission. It is one heck of a schedule of events for Commission staff over the next 8-months — with the final report due in May 2011.

As many folks continue to point out — this is the fifth “commission” of sorts into salmon and Fraser sockeye in the last two decades.

With the change in approaches demonstrated… maybe, just maybe, this will be the Commission that can institute real change in how Pacific salmon and specifically Fraser sockeye are cared for and looked after.

Salmon energy: what really is the “maximum sustainable yield”?

the full cycle -- Kline, jr.

Did you take highschool physics class and learn about the laws of thermodynamics?

Thermodynamics is the study of energy, which exists in many forms, such as heat, light, chemical energy, and electrical energy. Energy is the ability to bring about change or to do work.

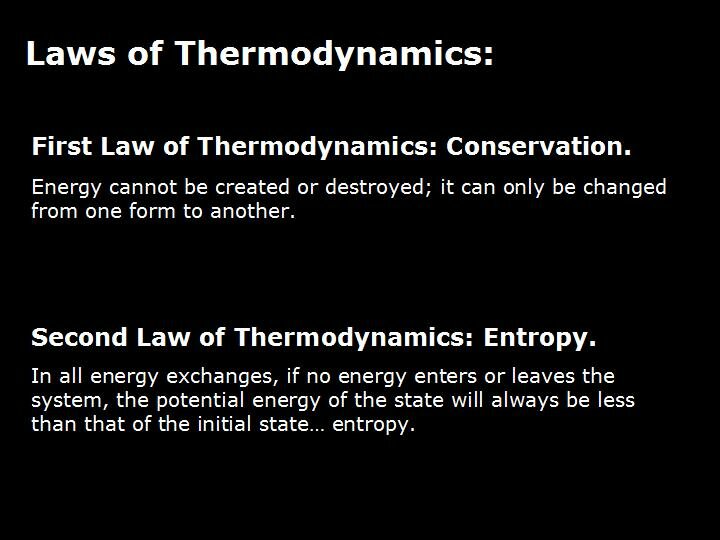
First Law of Thermodynamics: Conservation.

Energy cannot be created or destroyed; it can only be changed from one form to another. The total amount of energy in the Universe remains the same, merely changing from one form to another.

Second Law of Thermodynamics: Entropy.

In all energy exchanges, if no energy enters or leaves the system, the potential energy of the state will always be less than that of the initial state… entropy. For example, a car that runs out of gas will not run again until fuel is put in. The flow of energy maintains order and life. Entropy wins when organisms cease to take in energy and die.

Hmmm… let’s think about this for a moment.

Salmon start life as little fry. They swim out into the North Pacific and consume energy in the form of ocean critters. Salmon eventually return to their natal streams. Along the way the bundle of energy that they have become, is consumed by other critters — seals, orcas, eagles, etc.

Salmon enter their stream, swim up to their spawning grounds, some of the energy they consumed in the North Pacific is transferred into eggs and sperm, which is deposited into the gravel.

The adults die, however, it is by no means entropy. The adult carcasses are still bundles of energy that are in turn consumed by all sorts of critters. The bulk is most likely consumed by bugs. The bugs in turn become food for other critters… like baby salmon for example, or critters that baby salmon may feed on (esp. baby sockeye hanging out in lakes). Nothing is wasted.

And thus the first law of thermodynamics: energy is neither created nor destroyed; it just changes form.

_ _ _ _ _ _

But what about the second law?

What if one critter in the ecosystem (e.g. us, humans) decide that we want to take 80%, or 60%, or whatever % of the total energy supply returning to freshwater ecosystems in the form of adult salmon?

Aren’t these adult salmon sort of like the gas in the car tank?

Isn’t this a cycling of energy — fresh water to North Pacific to fresh water — that has been occurring for millions of years?

Sure we humans might put some of that energy back into the system through sewage treatment plants… however, a lot of it is exported to places that don’t have salmon: Wal-mart in Nebraska, Total in Wisconsin, Fred Meyer in Wichita… etc.

Add in that by us-humans taking energy out of the cycle and putting it somewhere else, we take energy away from the critters that rely on it — including the next generation of salmon.

Do a web search of Robert Bilby and “marine derived nutrients” and you can find lots of research on this simple fact.

Or this link:

Energy and nutrient subsidies transported across ecosystem boundaries are increasingly appreciated as key drivers of consumer–resource dynamics. As purveyors of pulsed marine-derived nutrients (MDN), spawning salmon are one such cross-ecosystem subsidy to freshwaters connected to the north Pacific.

With this in mind… what is the “maximum sustainable yield” of salmon in human fisheries?

Should one critter be taking anywhere between 50%-80% of the total nutrients and energy returning to fresh water systems from deep within the North Pacific?

If this practice continues… when does entropy set in? How do you spell precautionary?

Energy and nutrient subsidies transported across ecosystem boundaries are increasingly appreciated as
key drivers of consumer–resource dynamics. As purveyors of pulsed marine-derived nutrients (MDN),
spawning salmon are one such cross-ecosystem subsidy to freshwaters connected to the north Pacific.

Elephants and salmon…

State of the Salmon maps - Historical Range


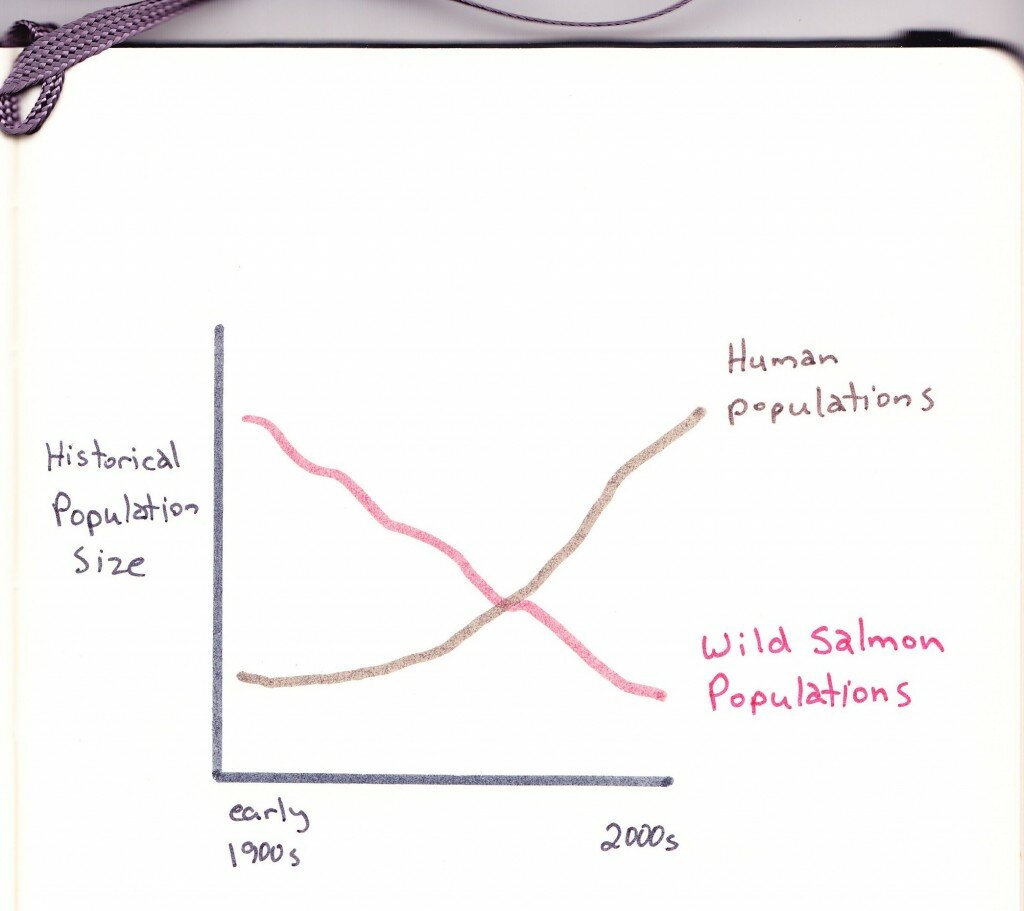
In August I charted this highly advanced graph:

correlation?

I’m certainly curious whether anyone has actually done any specific research on this topic (?)

Curiously, this type of research has been done on human-elephant interactions in Africa. Just the other day I came across this study and was quite surprised with the strong relationship with my graph from August.

.

The decline in the range and numbers of elephants as a result of expanding human activity in Africa is recognized as one of the continent’s most serious conservation problems. Understanding the relationship between human settlement patterns and elephant abundance is fundamental to predicting the viability of elephant populations.

Basically… humans and elephants do fine together up to a point — but… once human settlement reaches a certain density — no more elephants.

_ _ _ _ _

So what about salmon?

If you start looking at the map I started this post with… it probably starts to look this:

salmon distribution in trouble

Hmmm… do you see a pattern maybe?

For example, 95% of Japan’s commercial salmon fisheries are based on salmon ranching efforts… not much left for wild stocks… not much room.

Seems like salmon are ‘done, near extinction‘ or in ‘big trouble‘ (technical terms) in the same places where human populations and density are expanding rapidly. Like California, for example, where there’s more people (35 million or so) then all of Canada, and more cars then people…

Great for movie making and highway building… not so good for water supplies; really bad for salmon range — really, really bad for salmon.

_ _ _ _ _

Was human density in relation to salmon populations one of the twelve “scientific” studies initiated by the Cohen Commission into declines of Fraser sockeye?

No…And fair enough…

But there is this federal government agency (with a hefty budget) that is responsible for looking into these things.

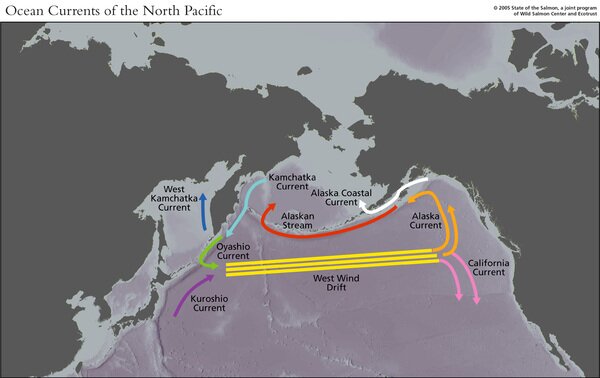
If salmon really, really mattered to governments — and the like — it’s probably something that should be looked at. There’s a heckuva lot more we can do about human settlement density (and it’s effluent) than we can about the North Pacific Gyre, or Aleutian Low, or those two pesky kids: El Nino and La Nina

State of the Salmon -- North Pacific currents

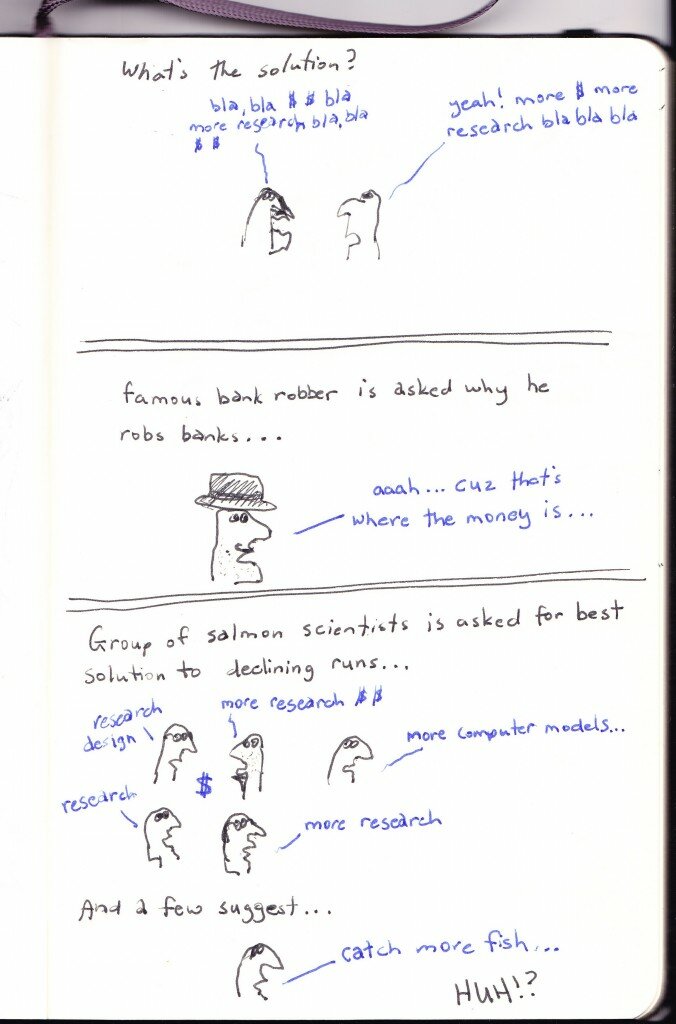
Yet many scientists and researchers — who coincidentally earn their living from research — are lobbying hard for more research on the ocean environment and its effects on salmon…

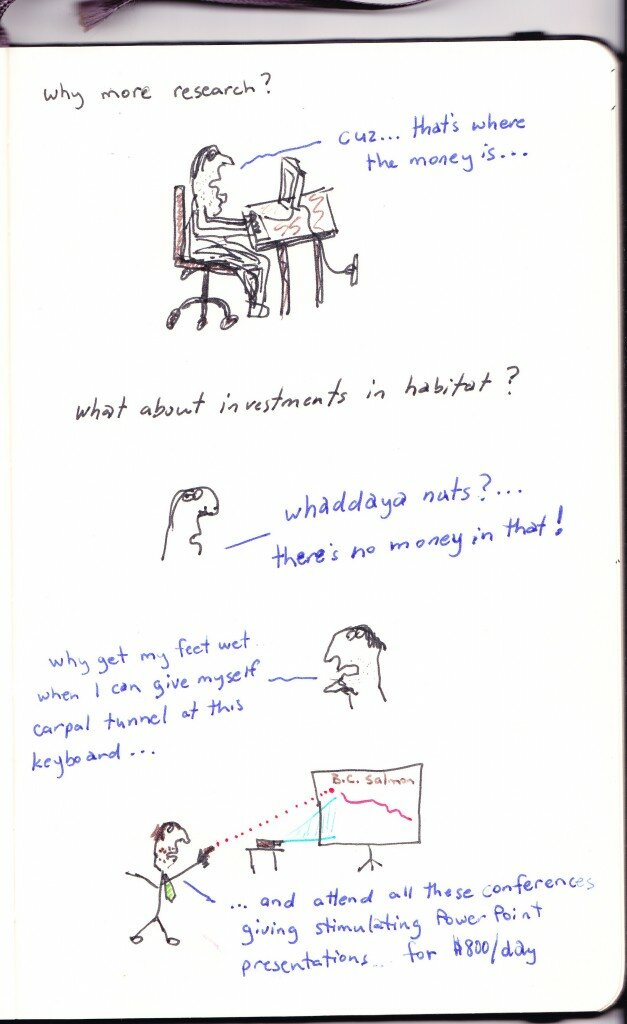
Maybe resources could focus on things we can actually do something about… like freshwater habitat, for example.

Not to say ocean research doesn’t have it’s place… it’s just that we’re not going to find the “smoking gun” out there. It’s kind of big… and vast…

_ _ _ _ _

Are salmon as important to the people of the Pacific Rim as elephants are to Africa?

Is trying to understand the relationship between human settlement patterns and salmon abundance fundamental to predicting the viability of salmon populations?

Somebody get the Fraser sockeye story straight, please…

As I’m preparing a presentation for the Cohen Commission this week, I recently noticed the on the Cohen Commission website. It’s a pretty sharp little production, some nice work by the P.R. firm hired by the Commission. I especially like some of the graphics — they portray the picture of a sockeye life quite well.

I have a problem though… there is a graph of Fraser sockeye populations early in the presentation. It looks like this (with the exception of the numbers and question marks I’ve added on the left… and it has some color):

If you look closely on the Cohen Commission video you can see the reference for this graph, little little words on the right:

Oddly, the graph comes from another “Commission”… ummm, the Mekong River Commission. Yeah, that river in Southeast Asia.

The report is called:

.

By, a Dr. Ferguson from Seattle and Dr. Healey from UBC.

There doesn’t, however, appear to be any references by the Dr.’s to where the graph comes from.

More oddly, this is the only graph I’ve been able to find that presents some history of Fraser sockeye prior to 1948 (the time when the great white knight of DFO galloped onto the scene and data became “reliable”).

Even more, more oddly — this is the best that the Cohen Commission can come up with to document historical Fraser sockeye populations? Some 2-3 page paper from the Mekong River Commission, with few data references?

This isn’t necessarily a criticism of the Cohen Commission… I just thought that they had already plowed through hundreds of thousands of pages of documents from the Department of Fisheries and Oceans. Could not one safely assume that somewhere in there would be a page or two that actually has some data-referenced graphs of historical Fraser sockeye populations?

_ _ _ _

I was recently scolded in an email from a “pre-eminent scientist” here in B.C.:

By the way, you need to get your story straight about how many sockeye salmon there used to be before commercial fisheries.

Yes, please, someone… would the real Fraser sockeye story please stand up and reveal itself!

See… I just keep referring to this 1903 Fisheries Report. Excerpts from the :

This year’s pack has been the largest known in the province amounting to 1,247,215 cases against 1,026,545 in 1897. 1,154,717 cases were sockeye salmon (O. nerka), exceeding the total pack of 1897 of all kinds of salmon. On Fraser River the pack of sockeye in 1901 was 974,911 cases as against 897,115 cases of all kinds in 1897.

If you are curious a case was 48 pounds.

The small print above reads:

Large as this amount is, representing 30,000,000 fish it could have been largely increased, possibly doubled had the canneries had capacity enough to have handled all the fish available during the run.  On Fraser river, the canneries placed 200 as the maximum number of fish they could guarantee to take from each boat and for 12 days, from 6th to 17th August this limit was enforced. The fishermen could consequently during this period fish only for a short time each day. During the height of the run they dare not put more than a small length of their net in the water. In some cases nets were sunk and lost from the weight of the fish.

_ _ _ _

The scolding email continues:

Ricker estimated 25-50 million based on early catch data, but Argue found errors in that and produced revised estimates of 12-25 million.

But this doesn’t fit so well with other references such as  Northcote and Atagi (1997) “Pacific Salmon Abundance Trends in the Fraser River Watershed Compared with other British Columbia Systems” in “Pacific Salmon and their ecosystems: Status and Future Options” (Stouder, Bisson, and Naiman – editors). You can view most of the book on Google Books – Northcote and Atagi’s chapter starts on page 199:  The actual reference is on page 200 and is further referenced to W.E. Ricker articles on Fraser sockeye.

“The historical abundance of pink and sockeye salmon spawners bound for the Fraser River was enormous with runs up to nearly 50 million pink and <160 million sockeye on a big cycle year (Ricker 1950, 1987, 1989).”

One of the tables in the chapter suggests the average “historical” abundance of Fraser sockeye is over 34 million.

“From Ricker (1987) for 1901-1913, using 100 million for the 1901 ‘line’ and 5 million for the 1902, 1903, and 1904 ‘lines’; see also Ricker (1950)”

_ _ _ _

How can there be so much damn variability?

A 1903 Fisheries report states that over 30 million sockeye were canned alone in 1902, with potential to have canned at least that much more. One can presume then that the run was anywhere between 60-100 million sockeye. That’s a far cry from the 12-25 million suggested in the scolding email I received and references to Argue’s research.

How could there only have been 12-25 million if over 30 million were canned alone (around the Fraser mouth)?

And so… could somebody please get the story straight. Because right now we’re somewhere between 12-25 million vs. greater than 160 million as estimates of Fraser sockeye populations pre-commercial fishing.

my graph

The “don’t bother” trilogy

"active adaptation..."

This coming week I’ll be making a presentation to the Cohen Commission as they make their way through Prince George, BC.

The Commission has requested folks make 10-minute limited presentations on the following suggested topics:

What is your vision for the sustainability of Fraser sockeye?

How can citizens participate in the recovery of Fraser sockeye?

What is required to secure the future of Fraser sockeye?

What are the major habitat issues for Fraser sockeye and how can these be mitigated?

How can Fraser sockeye be effectively harvested?

It’s tough, in that if one was to speak to each of those points… that’s less than 2 minutes an issue. Yet, I can respect that there is only so much time to do this process. Unfortunately, the quasi-legal, lawyer-heavy process won out — along with a science-heavy research agenda. All bundled together in a super packed timeline.

Tough choices.

_ _ _ _

I’ve been thinking through the components to include in a presentation, and may utilize blog posts over coming days to make that clearer.

This morning, these pieces came to mind:

where's the cake?

.

Now I recognize this probably doesn’t get me on any scientists Christmas card list… however, I haven’t heard much else coming out on the solutions list from the “experts”. There’s  quite a bit of… “there’s a lot of factors…”  and “we just can’t pinpoint one issue” and “it’s complicated”… but there’s not a whole lot of “here’s an idea” or “here’s something to try” or, maybe the simplest of all, “let’s just work on the things that we can actually work on..”

For example, freshwater habitat issues.

.

feet in creek or fingers on keyboard?

This week I’ve been reading a great book on fighting poverty around the world by Paul Polak (entrepreneur, inventor and self-identified “troublemaker” — . Polak is not a fan of the great “aid” approach to world poverty. He says stick with the simple solution… work with farmers to increase their income.

What a concept.

He operates by what he calls the “don’t bother” trilogy:

1. If you haven’t had good conversations, with your eyes open, with at least twenty-five poor people before you start designing, don’t bother.

2. If what you design won’t at least pay for itself in the first year, don’t bother.

3. If you don’t think you can sell at least a million units at an un-subsidized price to poor customers after the design process is completed, don’t bother.

Good advice. The “don’t bother trilogy”.

Here’s one, off the top of my head, for Fraser sockeye:

  1. If one hasn’t had good conversations, with one’s eyes and ears open, with at least twenty-five people in at least twenty-five communities before  starting to design “solutions”, don’t bother.
  2. If what you design won’t at least pay for itself in the first year, including computer simulation models subsidized by government agencies (and the Wild Salmon Policy), don’t bother.
  3. If you can’t manage a fish population subject to fisheries, un-subsidized, don’t bother.

Have one of your own?

salmon “over-escapement” and the Flat Earth Society

Please, please, please… someone put the over-escapement theory of salmon to rest. Take it out to the back-40 and put it to rest with that thing registered in the long-gun registry…

It is popping up this year in regards to Fraser sockeye, more than seal heads at the mouth of the Fraser or Skeena Rivers. Nature returning with bounty — for example this year’s many salmon runs — means everything benefits. I’m sure there is no shortage of grizzly or black bears that faced near starvation last year faced with the bleak 2009 sockeye run. Maybe it even shows in the health and number of cubs that were born during the hibernating months?

This year, many animals can fatten up their winter layers before being faced with several years of potential bleak runs again.

If we want to talk over-escapement:

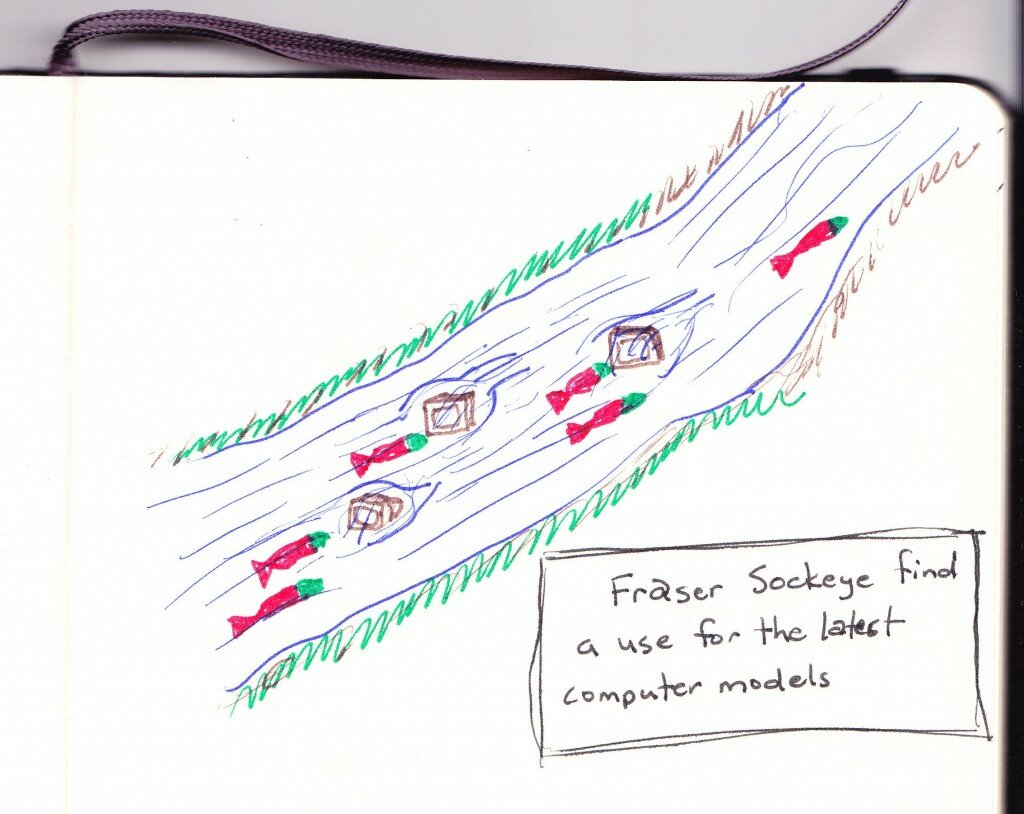
this year's late run Fraser sockeye prepare to head upstream...