As mentioned last week, I had the good fortune of coming across some pretty old reports on British Columbia Sockeye at a used book store.
This is the cover from the “British Columbia Fisheries Department 1933” report titled “Contributions to the Life History of the Sockeye Salmon. (Paper 19)” by William A. Clemens. It’s reprinted from the:
“Report of the British Columbia Commissioner of Fisheries, 1933”
These reports review the runs of sockeye on four of BC’s large sockeye-producing systems: the Skeena, the Nass, Rivers Inlet, and the Fraser.
The “Introduction” to this 1933 report seems to point to a common issue. In the fifth paragraph it states:
The history of the sockeye-fishery on the Fraser River is illustrated in Fig. 1 [below]. The enormous packs of the years 1897, 1901, 1905, 1909, and 1913 are conspicuous. While the calamitous rock-slide in the canyon at and above Hell’s Gate in 1913 was a factor in the elimination of this extraordinary cyclic run, it is evident that there has been a steady decline in the runs of the other three cyclic-years, and there is no reason to doubt that overfishing has been a most important factor in the decline of Fraser as a sockeye-producing area in all cycle-years. [my emphasis]
And here’s the part of this report I find quite interesting: Figure 1. “Packs of sockeye salmon on the Fraser River from 1895 to 1933, in thousands of cases. The continuous line represents the actual packs and the broken line the trend.”
What this graph shows is that in 1913 there were almost 2.4 million cases of canned sockeye salmon. Approximately 1.7 million of these were done in Washington but still based on Fraser River sockeye.
If you haven’t had a chance to read earlier posts on this topic — I recommend: and
Those two posts point to a serious discrepancy in the Fraser sockeye story.
The Cohen Commission into declines of Fraser sockeye presented in its earliest material a chart like this one below (i’ve added the numbers and question marks):
This graph, originally printed in a publication on the Mekong River in Asia, suggests that Fraser Sockeye only numbered about 25 million total run size in 1901 and about 37 million in 1913.
And if you’ve read all the various news stories from this past summer — many pundits were comparing this past year’s Fraser sockeye run to the 1913 run.
But there seems to be a problem…
See a 1902 Fisheries report “Thirty-fifth Annual Report: Department of Marine and Fisheries 1902” states:
… the total pack of Fraser river sockeye for this year [1901] reaches a total of 2,081,554 cases. [as demonstrated in Figure 1 graph from 1933 report above]
Large as this amount is, representing a total of 30,000,000 fish, it could have been largely increased, possibly doubled, had the canneries had capacity enough to have handled all the fish available during the run.
On Fraser river, the canners placed 200 as the maximum number of fish they would guarantee to take from each boat and for 12 days, from 6th to 17th August this limit was enforced. The fishermen could consequently during this period fish only for a short time each day. During the height of the run they dare not put more thati a small length of their net in the water. In some cases nets were sunk and lost from the weight of fish.
_ _ _ _ _ _
And so… if just under 2.1 million cases represent approximately 30,000,000 sockeye canned (a case is 48 lb) and reports suggest another 30 million were available to be canned what does this suggest about total run size? —
And… what does the 2.4 million cases of 1913 represent?
Well… the math would suggest approximately 36 million sockeye were canned in 1913. And, so what was the total run size?
The graph that the Cohen Commission is working with, suggests that we’re estimating the 1913 sockeye run solely by what ended out in cans.
_ _ _ _ _ _
And then, even despite the devastating rock slide, there were still over 500,000 cases of sockeye canned in 1917 [see Fig. 1 graph above from 1933 report] — the next big year of this cycle (1897, 1901, 1905, 1909, 1913…2010). That’s still approximately 7,500,000 sockeye: canned.
But I thought that the 1913 run was decimated by the rock slide? — apparently fish still got through, because there was still enough sockeye four years later to can over 7 million — 500,000 48-lb cases.
_ _ _ _ _ _
Could it not maybe be that the main problem is as exactly pointed out in the 1933 report above:
there is no reason to doubt that overfishing has been a most important factor in the decline of Fraser as a sockeye-producing area in all cycle-years.
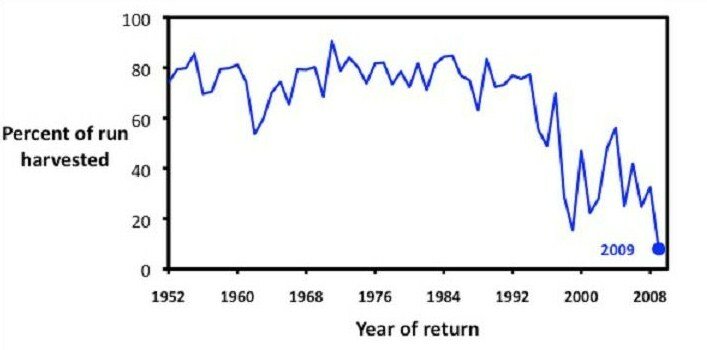
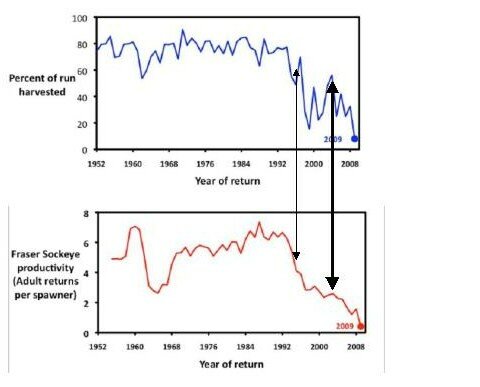
And so if we were being warned of overfishing in the first half of the 1900s, is it all that advisable that we were taking 80% of the total sockeye runs in commercial fisheries from the 1950s on?
Do we not learn lessons from the past?
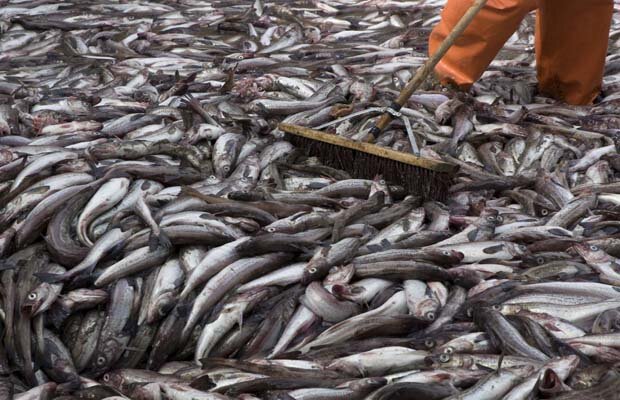
How is it that you spell “cod” again?
Oh right… “E” … “X” …”T” … “I” … “N” … “C” … “T” …
(at least commercially, and largely ‘functionally’ — why?
overfishing and mismanagement and lack of political will and too much bickering).


