Tag Archives: Fraser River Sockeye Spawning Initiative

Recipe for: Fisheries and Oceans Non-confidence cake

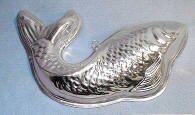
I think there might be a cake in the works (I’ve included a mold to bake it in). Some evidence of this can be seen in to Victoria to protest the impact of salmon farming on BC’s wild salmon, recent court cases that have found Fisheries and Oceans (DFO) is failing in their responsibilities, and a variety of other factors.

As a follow-up to on the current denial stage surrounding B.C. wild salmon, and the post from Saturday: which was a follow-up post to early March: — I am curious whether a non-confidence vote is brewing?

www.spruceroots.org

This idea is not a new idea. In early 2001 on Haida Gwaii (formerly referred to as the Queen Charlotte Is.) close to 20% of the adult population of the islands marched on to the British Columbia Ministry of Forests office and filed a vote of non-confidence. Over 600 ballots were cast that day and marched to the doors of the Ministry. (click the picture to read story).

[If you can’t read the placard it states: “MOF You’ve taken everything but the Kitchen Sink“]

The red stumps are part of the “Red Stump Brigade” which can still be found stuck into the ground near various Haida Gwaii driveways.

As John Vaillant suggests in his good read of a book: “The Golden Spruce: A True story of Myth, Madness, and Greed“:

“Out in Haida Gwaii, the rain keeps most fires at bay and coastal timber is far less susceptible to bug infestations that are devastating the interior. It is humans and things they carry with them that remain the greatest threat to the islands. A terrible irony is that, philosophically, Hadwin was in sync with much of the local population: in December 2000 an interracial group of islanders staged a protest — essentially, a no-confidence vote — against the Ministry of Forest’s handling of logging in the islands. There hadn’t been a demonstration of that kind in a decade, and this one was the biggest ever: 20 percent of the islands’ adult population participated. Since then there have been some striking changes not just in the way logging is practiced but in the status of the islands themselves.”

The irony that Vaillant is referring to is that “Hadwin” — Grant Hadwin — is the individual who cut down the revered Golden Spruce (an incredibly rare tree, the only one of its kind on Haida Gwaii)  in early 1997. He was trying to make a statement against industrial logging. Hadwin disappeared off the coast of BC not long after the incident.

It was a twisted approach to protest…however… is it all that different than suggesting that farming salmon in open-net pens on wild salmon migration routes is a good way to protect wild salmon?

Here ares some ingredients that might be proposed for a:

DFO Non-confidence Cake:

1. One half cup of not knowing one’s percentages very well.

The 2009 DFO Integrated Salmon Management Plan – last season – listed Fraser River early-timed Chinook as a “stock of concern” with the following conservation objective:  “to implement management actions that will reduce the exploitation rate approximately 50% relative to the 2006 [33.9%] to 2007 [54.4%] period.”  This means the objective was to reduce exploitation to approximately 22% (half of  average [44.2%] of 06 and 07).

  • Estimates just out from DFO suggest exploitation rate last year (2009) on early-timed Chinook were 48.7%. Not only did they not reduce by half — exploitation was actually almost 5% higher than the average.

(Disclaimer: this might actually be one cup, as opposed to 50% of one cup, or it might be two cups – hard to know when percentages are so confusing and which Ministry is measuring)

2. One overflowing cup of very effective lobby efforts in Ottawa

DFO’s own numbers suggest that exploitation rates on early-timed Chinook need to be 8-11% during times of low productivity like we are experiencing right now, and have seen for at least the last four years. Last year, the ocean sport fishery in Juan de Fuca alone — is estimated to have caught almost 12% of the Chinook destined for the Nicola river. This means this particular sport fishery alone is catching what DFO deems sustainable for the entire population.

  • Local estimates suggest that on peak fishing days there are well over 500 (maybe closer to 800) sport fishing boats in Juan de Fuca (from Victoria, B.C. up the Vancouver Island coast to Port Renfrew).
  • The Chinook sport fishery is open coast-wide in BC right now, despite terrible forecasts for this coming year and terrible returns of early-timed Chinook over the last four years.

3. Two cups of not being able to follow your own “recipe”

DFO’s Wild Salmon Policy explicitly defines what is meant by Conservation — the primary goal of salmon management:

Conservation is the protection, maintenance, and rehabilitation of genetic diversity, species, and ecosystems to sustain biodiversity and the continuance of evolutionary and natural production processes.

This definition identifies the primacy of conservation over use, and separates issues associated with constraints on use from allocation and priority amongst users.

Yet, when it comes to Fraser early-timed Chinook there are no conservation goals — only percentages attached to ‘constraints on use‘ as demonstrated in the statement:  “to implement management actions that will reduce the exploitation rate approximately 50% relative to 2006 to 2007.”  This is not a conservation goal, this is a constraint on use – which, coincidentally, was failed upon miserably; placing Nicola River Chinook (i.e. early-timed Chinook) on extinction watch.

4. A good dose of completely flawed computer simulation model based on less than 10% of a population.

See posts regarding Fraser River Spawning Sockeye Initiative (FRSSI). FRSSI simulates Fraser River sockeye populations based on — despite there being over 200 separate Fraser sockeye stocks.

This model is like trying to make a cake and only using 10% of the ingredients and then wondering why the heck the cake didn’t turn out as expected — or collapsed like a rusty lawn chair…

5. Three litres of very flawed economics, budget planning, and misuse of funds.

See post:

Further evidence? I was at a meeting late last week of approximately 50-60 people discussing DFO’s pre-season planning. When it came time to give DFO feedback they showed up at the meeting with 13 staff. That’s right, 13 staff when 2-3 would have sufficed. Many of these staff had taken at least two flights to get to the meeting, rented cars, and were there for two days staying in some hotel. What’s the estimated cost of that type of frivolous spending?

Directions for Mixing and Baking:

Bake these ingredients in a bureaucratic malaise of about 10,000 employees, an east coast Minister with a distinguished career in Revenue Canada, and decades of Royal Commissions, public inquiries, and Auditor General reports.

Suggested icing?

Lemon-Inaction Glaze (for enhanced tartness)

(Future recipes to come…)

cognitive compromise… huh?

In the 1950s, social psychologist Solomon Asch conducted some experiments into the ‘relativizing effect of conversation’.

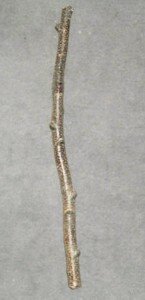
A small group of individuals was put in a room. All except one of them — the ‘victim’  — in each experimental group were told beforehand about the nature of the experiment. When the group gathered, the ‘victim’ was first shown an object — say a stick — and asked to estimate its length. Let’s say this stick is 24 inches  (two feet), and the ‘victim’ estimates close to the correct length.

Each of the other individuals (in the know) in the group were then asked the same question and as previously instructed, would come up with a ridiculous estimate — like 48 inches or four feet.

The experimenter then returns to the ‘victim’ and says something like: “It seems that you have a very different opinion from everyone else here. Why don’t you have another look at the stick and see if you might want to change your mind about your first estimate.”

Almost every ‘victim’ did revise, typically saying something like: “Well, maybe I did underestimate, maybe it isn’t 24 inches. Maybe it’s closer to 35-40 inches?” In other words, the ‘victim’ was pulled towards the ‘group norm’ or majority.

Curiously, if there were two ‘victims’ instead of one: the two would then huddle together and defend their (of course, perfectly reasonable) original estimate. If ‘victims’ and ‘non-victims’ were evenly divided, a vigorous bargaining process  typically ensued, leading to a cognitive compromise — that is a new “group norm.”

In Asch’s experiment, the dispute was about a matter that could easily be resolved by using a tape measure — although the experimenter denied this — and yet the cognitive power of conversation still led to compromise. In other words, conversation had a relativizing effect even on the perception of a physical object, the length of which could, in principle, be decided by using a measuring device.

When it comes to an individual’s views about certain realities that can’t be subjected to scrutiny by way of sense perception — such as religious or political views — there are no commonly agreed upon measuring devices. It follows that the power of conversation will be that much greater in those cases. What’s plausible, and what’s not plausible, will be largely determined by the nature of the conversation about it (i.e. shifting the “group norm”).

Sociology of knowledge suggests this phenomenon is a “plausibility structure.” This is the social context within which any particular definition of reality is suggested to be ‘plausible’ or ‘realistic’.

If you’re not familiar with the current fraud charges against U.S. banking and financial institution Goldman Sachs — which flows from flawed financial derivatives such as the sub-prime mortgage fiasco — check into it and you can see the power of ‘group norms’ and flawed ‘plausibility structures’ at work. Even former U.S. President Bill Clinton was quoted in media today apologizing for deregulating financial markets that largely led to the disaster of the last few years. (Curiously, one of Clinton’s main financial advisers at the time was a former Goldman Sachs executive.)

Thus… one might suggest that when Fisheries and Oceans convened (in 2003 and 2004) a group of “fisheries experts” to begin designing a computer simulation model to attempt to better look after sockeye salmon in the Fraser River — that ‘group norms’; ‘plausibility structure’ determined by conversation, and plain common sense might all be impacted.

The Fraser River Spawning Sockeye Initiative (FRSSI) has evolved from frequent gatherings of fisheries scientists (within and outside of Fisheries and Oceans) over the last eight years (see earlier posts and ). It’s a computer simulation model that’s supposed to give the Canadian public confidence that Fisheries and Oceans is best managing wild sockeye according to:

  1. Conservation  (i.e. not causing sockeye runs and stocks to go extinct and ensuring salmon support ecosystems)
  2. First Nation food, social, and ceremonial purposes (enshrined in Canadian Constitution and Supreme Court decisions)
  3. Well-managed commercial and sport fisheries

Unfortunately, maybe too many fisheries focussed scientists (and DFO bureaucrats) are now trying to suggest that maybe regular folks should simply shift to their 48-inch stick view — even though it’s quite clear the 48-inch estimates are significantly flawed.

Unfortunately, we can’t even have a discussion about it, because apparently the calculations that went into reaching the 48-inch stick estimate are so complex that us mere 24-inch stick seers will never understand. And thus, there is no ‘nature of conversation that might shift plausibility.’

“Just accept that we are right… we do not need any cognitive compromise.”

Sadly, the only measuring device we have to determine whether an 8-year, significantly flawed, computer simulation model for determining fishing options (even though there has been no Fraser sockeye fishery for 3 years) is the actual long-term health of the Fraser sockeye runs themselves over the coming sockeye generations.

Simple as that.

Therefore, for something as crucial as avoiding Fraser sockeye stock extinctions, do we want to be measuring by guesstimate built upon guesstimate, built upon silicon microprocessors to determine when “we’re going fishing”?

Or, do we want to base our measurements upon the health of rebuilding Fraser sockeye runs to somewhere between the 165 million sockeye of the peak cycle years of the 1800s — and the 15 million or so average of the late 1900s?

(Last year saw about 1 million return)

Rather than determining ‘fishing options’ should we maybe focus more on rebuilding and precaution?

Rather than 8 years and countless millions of dollars on staff/consultant time and computer hardware; maybe put countless million of dollars into habitat restoration and conservation?

Rather than spending more money trying to convince everyone a computer simulation model is the answer and to accept this as the group norm — why not demonstrate some actual measures of what a rebuilt Fraser sockeye run might look like, should look like, once looked like, could look like…?

Free money — Part II

Yesterday was a on finding free money through my “FLIRT model” (Free Lunch/Investment Return Tool). (Note: I’ve resorted to pen and paper to start drawing some of this stuff out — computers often get kind of limiting in this sense…)

Today, I’d like to introduce my latest investment strategy model; it’s called Formulating Really Super Strategic Investments (FRSSI) – we’ll call it “frizzy”… to keep it fun.  This frizzy model is so great.  It takes information from a stock market — let’s call it the Fraser Market, for simplicity sake.

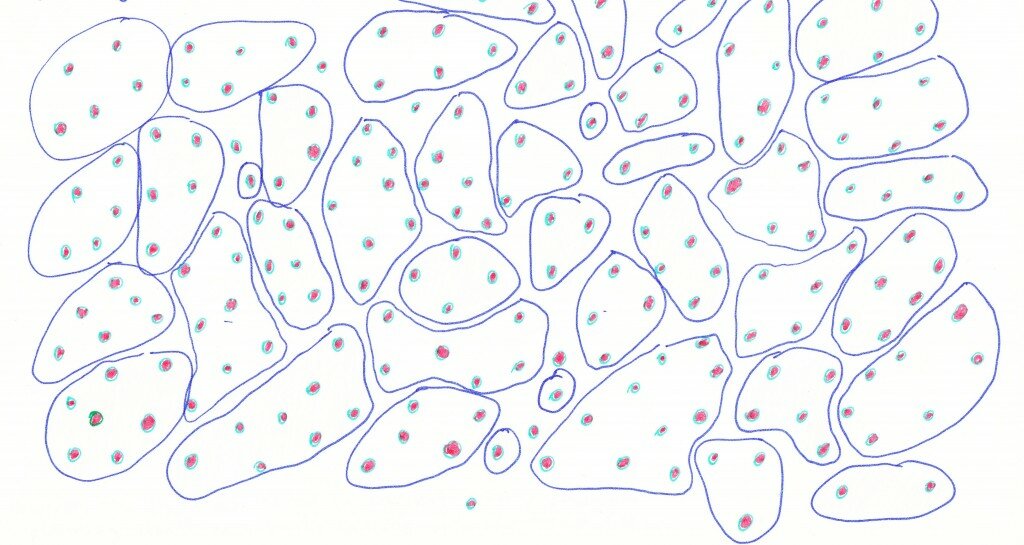
Approximately 200 separate stocks

In the Fraser Market are approximately 200 individual stocks. Some of these stocks are big; some of these stocks are medium size; some are small. However, all of these stock are individually unique; distinct; diverse.

Upon further analysis, and the introduction of some new legislation in 2005 — the Winking Stock Policy (WSP) determined that in actual fact, these 200 separate stocks are not entirely unique — there are some shared similarities and many of these stocks could be grouped together into common Conservation Units (CUs).

Some scientific analysis, several consultations,  Peer Review (PR) and countless meetings later; it is determined that these 200 stocks can actually be grouped into a little over 40 separate CUs.

Approximately 40 CUs

Some of these CUs have five or six similar stocks; some only have one or two stocks; and some stocks were left out of the mix because they just didn’t fit the mold.

However, for our FRSSI simulation Free money forecasting tool, we actually decided not to use the 40+ CUs in the investment forecasting.

We recognize that there is some other planning and consultation going on in relation to the CUs, but we’ve actually come up with a better plan — we’re only going to use information from 19 stocks in our forecasting simulations. We’re only using the 19 stocks because these are the bigger stocks — the more productive stocks that are going to ensure our annual returns (and Free Money). By concentrating on these bigger stocks we won’t waste our time on those smaller stocks that bring fewer returns — the bigger stocks are much better at guaranteeing we can harvest some of our returns every year.

We don’t have good information on the other 20 or more CUs and other 180 individual stocks — those are small stocks so we don’t worry about them in our simulations. We focus on the nineteen big fellas…

By focusing on the nineteen big returning stocks and using information from the past, we can actually extrapolate results and forecast for the entire 200 stocks anyways and thus the entire Fraser Market.

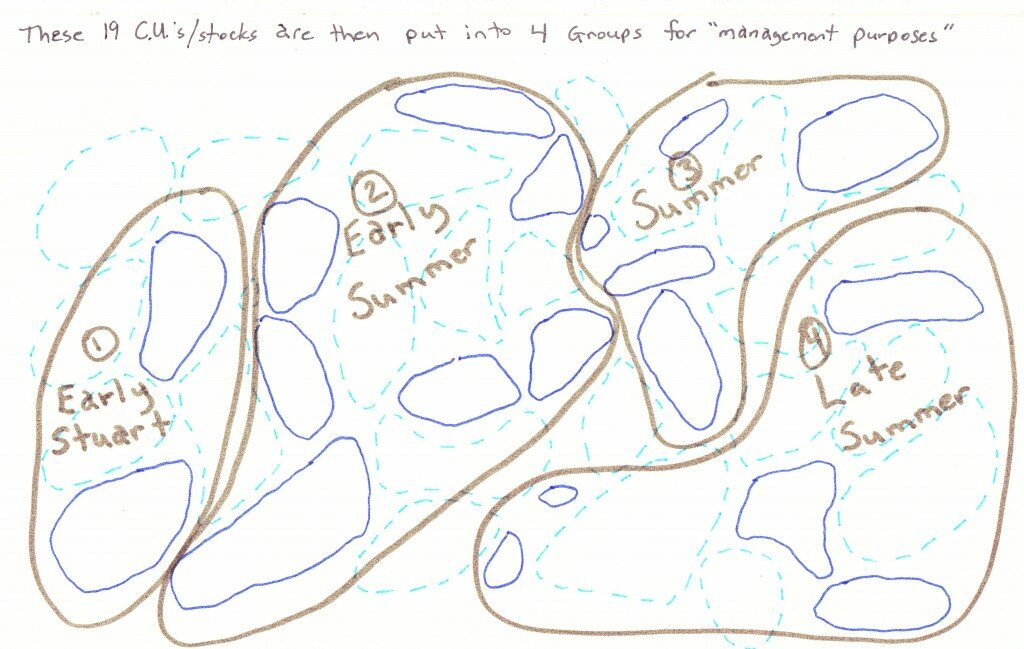
Now… to further simplify our FRSSI calculations we have further grouped our 19 stocks (some are also CUs) into four aggregates — or groups — for “management purposes”. Based on timing within the Fraser Market and when the market produces returns, we have named these four aggregates: Early Stuart, Early Summer, Summer, and Late Summer.

200+ stocks into 40+ CUs into 4 Aggregates

It’s an incredibly, forward-thinking, forecasting model for Free Money.

The computer model takes information from the past on these 19 of 200 stocks (~10%). These have then been broken down into four groups. This information then simulates returns for the future.

Based on the simulated returns for each of the 19 stocks, various options for how we want to harvest our returns are presented — these are based on forecasting out for the next 48 years and how that will impact our investments.

It’s truly remarkable. We have successfully designed a method for securing Free Money, when we only have patchy information on 19 of 200 stocks. We have then made four groups out of those 19 stocks; we then forecast your free money returns based on simulations that don’t even need to consider any outside influences.

It’s brilliant, simple, and….

………..

Screeeeech!! (sound of needle across record…)

Is this sounding a little ridiculous? It is.

However, this is how Fisheries and Oceans Canada has designed a computer simulation forecasting model for managing Fraser River sockeye. The acronym is FRSSI — frizzy — the Fraser River Sockeye Spawning Initiative.

This computer simulation program has been developed over the last eight years at a cost of countless million of dollars and staff time. FRSSI is supposed to be a “Pilot Study” within the Wild Salmon Policy; however it appears that it is becoming an official planning tool.

One of the fundamental principles of the computer simulation model is the theory of stock-recruitment analysis (see yesterday’s ). Stock-recruitment (S/R) analysis is built upon some fundamental assumptions. One being, that it only considers the relationship between number of spawners (stock) that reach spawning grounds and the number of returns four years later to the same spawning grounds (recruits).

It does not consider productivity of the freshwater environment, the ocean, predators, and so on, and so on.

Just “STOCK”……….. and……….”RECRUITS”.

A further problem, beyond it’s very narrow considerations, is that it takes over four years to get one data point to then put on a graph. For example, this many spawners (stock) this year….. four years later this many spawners (recruits) = one data point. Fisheries and Oceans has only really been keeping track of some stocks (generally the bigger returns) since 1948, or so. If it takes two separate years to get one data point to graph – this means in the last 60 years of collecting information, we only have 30 data points to graph.

Is this enough points on a graph to determine trends?

Let’s add another serious hiccup into this strategy…

Counting fish is hard stuff. Sockeye swim in schools, they swim deep in a river, shallow, middle, side and so on. They also spawn in rivers where it can be tough to see anything in the water (every visited the Chilcotin River in the Interior — it runs glacial blue-green with huge loads of silt).

Thus, various methods have been devised to count fish. On smaller runs, it’s often simple visual counts. Sometimes this is done on foot, sometimes this is done from a helicopter, sometimes its done by counting carcasses on gravel bars. On larger runs, there’s sonar counts, DIDSON, catch-per-unit of effort in test fisheries, and mark-recapture methods.

Numerous studies have been done to test the accuracy of all these methods. Visual methods generally estimate salmon runs too small. Mark-recapture — utilized to count bigger runs — often over-estimate salmon run sizes. Bottom line is that getting an accurate count on the size of a spawning run (i.e. the number of returns) is a highly variable exercise — nothing more than guesstimates.

Thus, our stock-recruit graphs, with limited data, can have margins of error anywhere between 1% to say 80%. Fisheries scientists are then using this wide margin of error data, with limited data points, to put on a graph and then determine “trends”.

Worse yet — FRSSI is built upon the assumption of the (yesterday’s post) on stock-recruit graphs. For example, the Chilko (tributary to Chilcotin River in BC Interior) run shows a classic dome-shaped relationship in the number of recruits per spawner from four years previous. So does the Quesnel River run that migrates into Quesnel Lake.

from DFO "Fraser Sockeye Escapment Strategy 2010"

This dome-shaped relationship suggests that the number of recruits produced by each spawner declines as spawner abundance increases. The theory is too many eggs and too many baby salmon reduces productivity. Thus to ensure maximum productivity in the ecosystem, humans have to harvest a bunch of salmon.

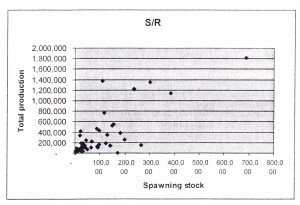
However, the Early Stuart sockeye run in the Fraser does not have this “dome-shaped relationship” in its stock-recruit graphs. That graph almost displays the complete opposite — an increase in “recruits” with an increase in spawners.

Early Stuart sockeye S/R plot

A colleague of mine the other day used the term “voodoo science”.

This computer simulation model for forecasting Fraser River sockeye returns is little more than voodoo science.

It is based upon data that are best-guesses (i.e. spawner counts and recruits). It only uses data from 19 sockeye stocks out of over 200. Then determines fisheries catch-levels for the entire Fraser River based on four aggregates of the 19 stocks.

The information on the 19 stocks is patchy and inconsistent and only goes as far back as the late 1940s. Worse yet, the 19 stocks don’t fit within the actual Conservation Units (CUs) that DFO has determined as part of the Wild Salmon Policy. Some of the individual stocks comprising the 19 are actual CUs, but some of the others are just stocks within a CU. It’s a patchwork quilt.

The forecasting model does not account for a train-wreck in productivity, climate change, high river temperatures, changing ocean conditions and so on.

If we wouldn’t trust an investment scheme designed this way (oh wait, we did, it’s called subprime mortgages and financial derivatives…) — then why should we “manage” an iconic species this way?

Yes, this is a somewhat simplified explanation of the tool — however, it does not take away from the fact that this forecasting model is built upon estimates; not exact science.

Would we construct a building this way, or a bridge? Would we sail along the west coast of Vancouver Island in a boat built upon simulated estimates? Would we put our kids on a plane built this way?

What if we took the money that was, and is continuing to be spent on this voodoo-science tool and put it into things we actually know we are having an impact on — like habitat damage, urban effluent issues at the mouth of the Fraser, water extraction from critical rivers, and so on?

What if we took the money that is being spent trying to “consult” on this tool that barely anybody understands — including a large portion of DFO staff, the Minister of Fisheries, and so on — and put it into community stewardship programs?

What if we took this colossal waste of money and put it into actually getting better counts of the number of spawners — rather than trying to simulate them in an office in Vancouver?

Aren’t we trying to get our kids off the Gameboys and computer simulation games and sending them outside to use their imagination and play in streams — why are we then wasting money, time and resources on designing computer simulation, voodoo-science tools to apparently do a better job of looking after wild salmon?

Instead of moving a mouse across a table, and our eyes across a computer screen, why not move our eyes across a stretch of river?

That’s exactly what I’m going to do right now…. off the computer and outside.

What does buying a fridge and looking after wild salmon have in common?

This is not meant to be a joke, but it may end that way.

Or… well…maybe it’s more of a story. Maybe a fable… or parable.

The story begins with a computer simulation model developed by Fisheries and Oceans Canada (DFO). The modeling program is called the Fraser River Spawning Sockeye Initiative (FRSSI — referred to cutely as: “frizzy”).  This computer simulation model, FRSSI, is apparently a pilot study as part of implementing the federal Wild Salmon Policy, which came into legislation in 2005.

The modeling program development began back in 2003 when apparently — and this is a quote straight out of the Executive Summary of a 2008 DFO paper (Pestal, Ryall, & Cass) — “In 2003, Fisheries and Oceans Canada (DFO) committed to reviewing the rebuilding plan which had been in place since 1987…”

(Yeah… good thing they decided to commit to a plan that had been in place for 16 years…)

Between 2003 and 2005 the computer simulation model was developed through DFO staff and a variety of workshops with outside experts (30-40 of them). Through 2006 and 2007 “an intensive two-year planning exercise” was undertaken to bring the FRSSI in line with other “integrated planning” exercises (also with many outside experts). Apparently, for the 2007 season: “new escapement strategies were fully implemented… and updated through the 2008 season.” It was also utilized for planning last year — the 2009 season.

If you haven’t heard about those three fishing seasons… there were none. Three bust seasons for commercial fisherfolks targeting Fraser sockeye.

Good thing this multi-million dollar computer simulation model (pilot study) was in place.

It gets worse…

There are very few folks out there that actually understand this computer simulation/modeling/forecasting program. Yet, “extensive consultations” continue. Recently, I sat through a few presentations whereby DFO tried to justify the program — as well as avoid the question of when this FRSSI is no longer considered a Pilot Study within implementation of the Wild Salmon Policy.

I will get to the process that I have undertaken to try and understand this computer simulation program — in the meantime this is where Fraser sockeye management and refrigerators — cross paths.

In one of the Appendices to the 2008 DFO report quoted above there is an attempt to explain “jargon used in performance evaluation”. The evaluation is apparently referring to the “performance” of “escapement strategies” — meaning: did enough Fraser sockeye reach the spawning grounds to successfully spawn and propagate the next generation of salmon.

I was intrigued by the name of this appendix as I perused the table of contents for this over 90-page report that explains the FRSSI. However, it is probably one of the most confusing, pathetic, ridiculous attempts at using analogies to explain “jargon” — and quite truly it fits the overall theme of this modeling program.

Apparently:

The approach for comparing [salmon] escapement strategies is identical to the steps used by testers of consumer products such as refrigerators.

Wow, I didn’t realize it was this simple. I’ll keep my eyes open for the next issue of Consumer Reports that reviews Fraser River sockeye escapement strategies…
Step 1: Management objectives

Objectives describe the desired end-results of the management process, but should be clearly defined upfront.

The first question faced by product testers is: “What matters to people when they choose a refrigerator?” The most fundamental objective is that the fridge needs to keep food reliably at a safe temperature. Assuming that new fridges sold in Canada meet the required safety standards, the attention of testers can shift to secondary objectives such size and affordability.

Ok, we’re on the right path here… Management objectives describe the desired end results  of the management process, but should be clearly defined upfront… in other words, what are we doing here?

Thus, when it comes to Fraser sockeye, or any Pacific wild salmon for that fact — is that similar to the refrigerator keeping food safe, we want to know that DFO is doing all they can to make sure wild salmon are safe and well-looked after; when we got to the fridge we expect to see wild salmon thriving, reproducing, and feeding the ecosystem as it always has, as well of thousands upon thousands of people as they always have.

But no…

Managing Fraser River sockeye is a lot more complex than buying a fridge, and needs to incorporate a wide range of biological, social, and economic considerations…

Oh… so what you’re actually saying is that the buying refrigerator – managing salmon escapement thing, actually has no similarities. Umm… great analogy, folks…

Worse yet… Apparently, the Spawning Initiative focuses on “the balance between two fundamental objectives”:

  1. ensuring escapement and production for individual stocks, and
  2. accessing the catch-related benefits from productive stock groups.

I’m confused… I thought the fundamental objective for DFO and the Wild Salmon Policy is:

Conservation of wild salmon and their habitat is the highest priority for resource management decision-making… The policy places conservation of salmon and their habitats as the first priority for resource management.

The Fraser River Spawning Sockeye Initiative is a “Pilot Study” within the Wild Salmon Policy this means that the first priority is conservation of salmon and their habitats. No balancing objectives, no focusing on bigger runs to harvest… no, no, and no.

Things deteriorate further from here…

An important part of the planning process is to translate these fundamental objectives into performance measures that can be used to compare simulation scenarios.

Step 2: Performance Measures (a.k.a. indicators)

Performance measures are clear numerical descriptions that reflect the general intent of management objectives, can be consistently evaluated, and can be easily compared.

Performance measures likely to be considered by people looking at refrigerators include more specific aspects of general objectives such as size and affordability. Some interesting performance measures that relate to the size of the fridge include width, height, storage capacity, and required floor space…

Performance measures considered in the Spawning Initiative reflect more specific aspects of the general biological, social, and economic objectives.

Oh, here we are again… “what we’re actually trying to say is that buying fridges and looking after salmon don’t actually have anything in common.”

Some interesting biological performance measures are longterm average escapement, long-term average run size, year-to-year variability in escapement, escapement trend over next 12 years, and the lowest projected escapement over 48 years. Each of these performance measures can be calculated for individual stocks (e.g. Chilko), for the four management groups (e.g. Early Summer), or the total Fraser system.

This is where things begin to resemble brown, pie-shaped, piles of wet, steamy stuff that tends to be found near the rear-ends of male bovines. (And the topic of an upcoming post… stay tuned).

To finish off these thoughts regarding this appendix that was supposed to assist with jargon — let’s get some assistance from DFO on “benchmarks”.

Step 3: Benchmarks
Benchmarks are specific levels of a performance measure that establish a meaningful context for a broader audience.

Huh?!

I thought this was supposed to be assisting in translating jargon; not a lesson in using almost 20-words to say nothing of substance.

In the end; trying to get some clarity on jargon associated with the Fraser River Spawning Sockeye Initiative, my conclusion, is that buying a fridge and looking after Fraser sockeye actually have nothing in common (other than sometimes both can be silver).

The aimless wandering, pointless analogies, confused priorities, and general malaise related to FRSSI is a fine summary of this “Pilot Study”. The Fraser River Spawning Sockeye Initiative appears to have more in common with the financial policies of Enron and Bre-X than it does with conserving wild salmon and their habitat.

Moral of the story… you tell me?

Salmon and the military complex…?

Five Salmon by Simon Davies

When it comes to “managing” salmon — “escapement” is the term given to the total amount of salmon that “escape” various fisheries on their journey back to their spawning grounds. In normal language; escapement means an estimate of the number of spawning salmon in a river.

I don’t want to sound like a sappy, tree-hugging, nature freak carrying on about the beauty of the wild salmon cycle — yet… it really truly is an incredible thing. There’s a reason why programs such as “Salmon in the Classroom” have such success. Kids are no dummies — the wild salmon story is cool and fascinating.

It’s the same reason programs like “Stream of Dreams” (see link in blog roll on right) are so successful and appreciated. One reason is the great people involved traveling around to schools and getting kids and teachers interested; another reason is that kids can relate to the impressive salmon journey.

Jiinanga - "Government Creek" - Haida Gwaii

An impressive journey that ends in sure death… yet the death is what feeds the next generation. The carcasses of the parents are the magic elixir for the next generation of baby salmon — as well as everything else that depends on this annual return of nutrients: from trees to tree frogs.

Maybe one could compare the number of popular kids books that involve heroes traveling to far, far away lands returning home wiser, smarter, and maybe carrying the magic elixir. This isn’t just a kids thing — Joseph Campbell dedicated his life to studying this phenomenon in stories from around the world with books like: “The Hero with a Thousand Faces“.

It is an amazing thing — the wild salmon cycle. For hundreds of thousands of years, if not millions, wild salmon have done their thing. For a long, long, long time people and salmon have co-existed. So long is the relationship, that stories abound across western North America of a supernatural relationship between people and salmon. As I’ve quoted in other posts with information from the British Columbia Treaty Commission:

It is said that the Nisga’a, people of the mighty river, are so connected to fish that their bones are made of salmon.

And yet… And yet… here we are in the dawn of the 21st century having a real serious look at our relationships to wild salmon. In a matter of one hundred years, the practice of “fisheries management” has proved its worth. Somebody show me a population of fish that is actively “managed” by fisheries science that is on an upswing — or even maintaining.

Is it the ‘tragedy of the commons’ or simply the tragedy of stupidity?

The ‘tragedy of the commons’ seems to be a convenient term to describe European-based methods of trying to “manage” natural systems. When it comes to wild Pacific salmon, even up to a few hundred years ago the tragedy of the commons never existed in western North America. Salmon supported one of the densest populations of people in North America for many thousands of years.

What the hell happened?

Language happened… that’s what.

A little closer look at the language we use to describe our relationship with wild salmon — illuminates much. As I read through the endless documents relating to the upcoming salmon season — dictionary and bullshit-bumpf translator in hand — it begins to sound like a military exercise.

Start with the term escapement to refer to spawning salmon. Why don’t we label the most essential piece of propagating the species a fugitive?

Or, in commercial fisheries language, we don’t call actual salmon caught: “fish” or even “salmon”. We call them pieces. How many pieces did you catch? (this makes sense…)

These past few weeks I’ve been wading through documents describing a population computer model that Fisheries and Oceans is utilizing to design “Escapement Strategies” for Fraser River Sockeye. It’s called the Fraser River  Sockeye Spawning Initiative (referred to as FRSSI or ‘frizzy’).

So we’re designing strategies for fugitives.

The curious thing with the word “strategy” is that it evolves from military planning. The free online dictionary defines strategy as:

a. The science and art of using all the forces of a nation to execute approved plans as effectively as possible during peace or war.
b. The science and art of military command as applied to the overall planning and conduct of large-scale combat operations.

The word comes from: “Greek stratēgiā, office of a general, from stratēgos, general”

So I suppose one might suggest, that the Department of Fisheries and Oceans is at war with someone or something — or at least looking to exert military-like command over those damn salmon.

How about this language?

From the Guiding Principles of this year’s: “Fraser Sockeye Escapement Strategy 2010“:

Annual targets for each management group are based on escapement strategies that specify target levels of total mortality across different run sizes. Escapement strategies for each management group are designed to protect component stocks and stabilize total harvest across all sectors.

Now does this not sound like a line straight out of Operation Desert Storm?

Wild salmon are now part of management groups. Those groups are based on escapement strategies. The escapement strategies are based on target levels of total mortality. And.. what’s a component stock?

And, thank ghad we’re stabilizing harvest….

Oh wait… there hasn’t been a commercial fishery on Fraser River sockeye in three years…

Another guiding principle:

The exact shape of the escapement strategy for each management group […] is selected based on simulated performance and reviewed in public consultation.

Hmmm… so the plan for controlling fugitive spawning salmon that apparently signed up for one of the Board of Director sub-committees is chosen based on a print-out from a computer (i.e. simulated – and I’m guessing this is not like simulated bacon bits…). This print-out from a computer is then the subject of a political decision… oh wait, no, I mean: “public consultation”.

Take out the “l” in public… and we’re probably closer to the effectiveness of this process.

The great irony of all this “fisheries management” language straight out of military schools is that the military teaches a concept called Commander’s Intent (CI). I came across this idea in Chip and Dan Heath’s book: Made to Stick – Why some ideas survive and others die.

Every move an Army soldier makes is preceded by a staggering amount of planning, which can be traced to an original order from the president of the United States. The president orders the Joint Chiefs of Staff to accomplish an objective, and the Joint Chiefs set the parameters of the operation. Then the orders and plans begin to cascade downward — from generals to colonels to captains.

The plans are quite thorough, specifying the ‘scheme of manuever’ and ‘concept of fires’ — what each unit will do, which equipment it will use, how it will replace its munitions, and so on. The orders snowball until they accumulate enough specificity to guide the actions of individual foot soldiers at particular moments in time.

The Army invests enormous energy in its planning, and its processes have been refined over many years. The system is a marvel of communication. There’s just one drawback: The plans often turn out to be useless.

“The trite expression we always use is No plan survives contact with the enemy,” says Colonel Tom Kolditz, the head of behavioral sciences division at West Point. “You may start off trying to fight your plan, but… unpredictable things happen — the weather changes, a key asset is destroyed, the enemy responds in a way you don’t expect. Many armies fail because they put all their emphasis into creating a plan that becomes useless ten minutes into battle.”

(Sort of like spending 8 years – and countless millions of dollars – developing a computer model to pump out simulated bacon bits — I mean… “options” for fishing sockeye and then not having enough sockeye to fish… three years running.)

Colonel Kolditz says, “plans just don’t work on the battlefield.” Therefore the Army invented a concept called Commander’s Intent (CI).

CI is a crisp, plain-talk statement that appears at the top of every order, specifying the plan’s goal, the desired end-state of an operation… The CI never renders so much detail that it risks being rendered obsolete by unpredictable events. “You can lose the ability to execute the original plan, but you never lose the responsibility of executing the intent.”

The key to the CI is simplicity – as in finding the core of the idea.

So what is the core of the idea of the 2010 Fraser Sockeye Escapement Strategy? — a 36-page ‘plan’ that is “simulating the life cycle and harvest of Fraser sockeye”

Should we really be using military ‘strategy’ to guide our relationship with wild salmon?

Should we be basing our salmon relationship decisions on a computer simulation model?

Could we not develop simple, meaningful language to guide our salmon relationship — rather than empty, meaningless bumpf?